
- PRICING
- LIVE QUOTES
- LEARN
- HELP


EN
JEOL (TSE:6951) Following Its Recent Rally Looks Fully Valued
JEOL (TSE:6951) has drawn investor attention after recent share price moves, prompting a closer look at how its scientific instruments, industrial equipment, and medical technology segments line up with current market expectations.
Recent trading has been strong, with JEOL’s share price up 1.65% over the past day and delivering a 7.73% 1 month share price return. Its 52.71% year to date share price return and 58.22% 1 year total shareholder return point to building momentum rather than a short term spike.
Scan for other JEOL style momentum stories across scientific instruments and advanced equipment by checking our hand picked 74 high quality undiscovered gems before you move on.
Bulls point to JEOL’s recent share gains and earnings growth, while bears flag valuation risk after such a strong run. Do the current numbers justify the optimism, or is the price running ahead of itself?
Price-to-Earnings of 23.8x: Is it justified for JEOL?
Valuation looks punchy here, with JEOL trading on a P/E of 23.8x, which prices the stock richer than both its industry and internal fair value checks.
The P/E ratio compares the current share price to earnings per share, so a higher figure means investors are paying more today for each unit of profit. For a business like JEOL that sells scientific instruments, industrial systems, and medical equipment, this metric often reflects how the market is weighing its earnings profile against future expectations.
Analysts currently expect earnings to grow 21.27% per year, which is a strong pace relative to the broader JP market forecast of 9.1%. That kind of projection can help explain why investors are willing to pay a premium multiple, even with recent earnings declining 19.2% over the past year and Return on Equity sitting at a relatively low 11.2% compared with a 20% threshold that many investors use as a quality marker.
The tension shows up in the comparisons. The 23.8x P/E is higher than the JP Electronic industry average of 16.6x and also above an estimated fair P/E of 21.9x. It is also slightly above the peer average of 23.6x, which suggests JEOL is being priced at the expensive end of its group rather than at a discount.
Explore the SWS fair ratio for JEOL.
Result: Preferred multiple of 23.8x price-to-earnings (OVERVALUED)
Still, any slip in earnings against those 21.27% forecasts, or a reset in sector P/E multiples, could quickly challenge the current premium around JEOL.
Find out about the key risks to this JEOL narrative.
Another View on JEOL’s Value
On a cash flow lens, the story shifts. JEOL trades at ¥7,689 while the SWS DCF model points to an estimate of ¥3,583.4 for future cash flows, which frames the stock as expensive rather than cheap on this second yardstick.
That kind of gap can signal optimism that cash generation will beat conservative assumptions, or it can hint at valuation risk if forecasts do not materialise. Which side of that trade do you want to be on?
Look into how the SWS DCF model arrives at its fair value.
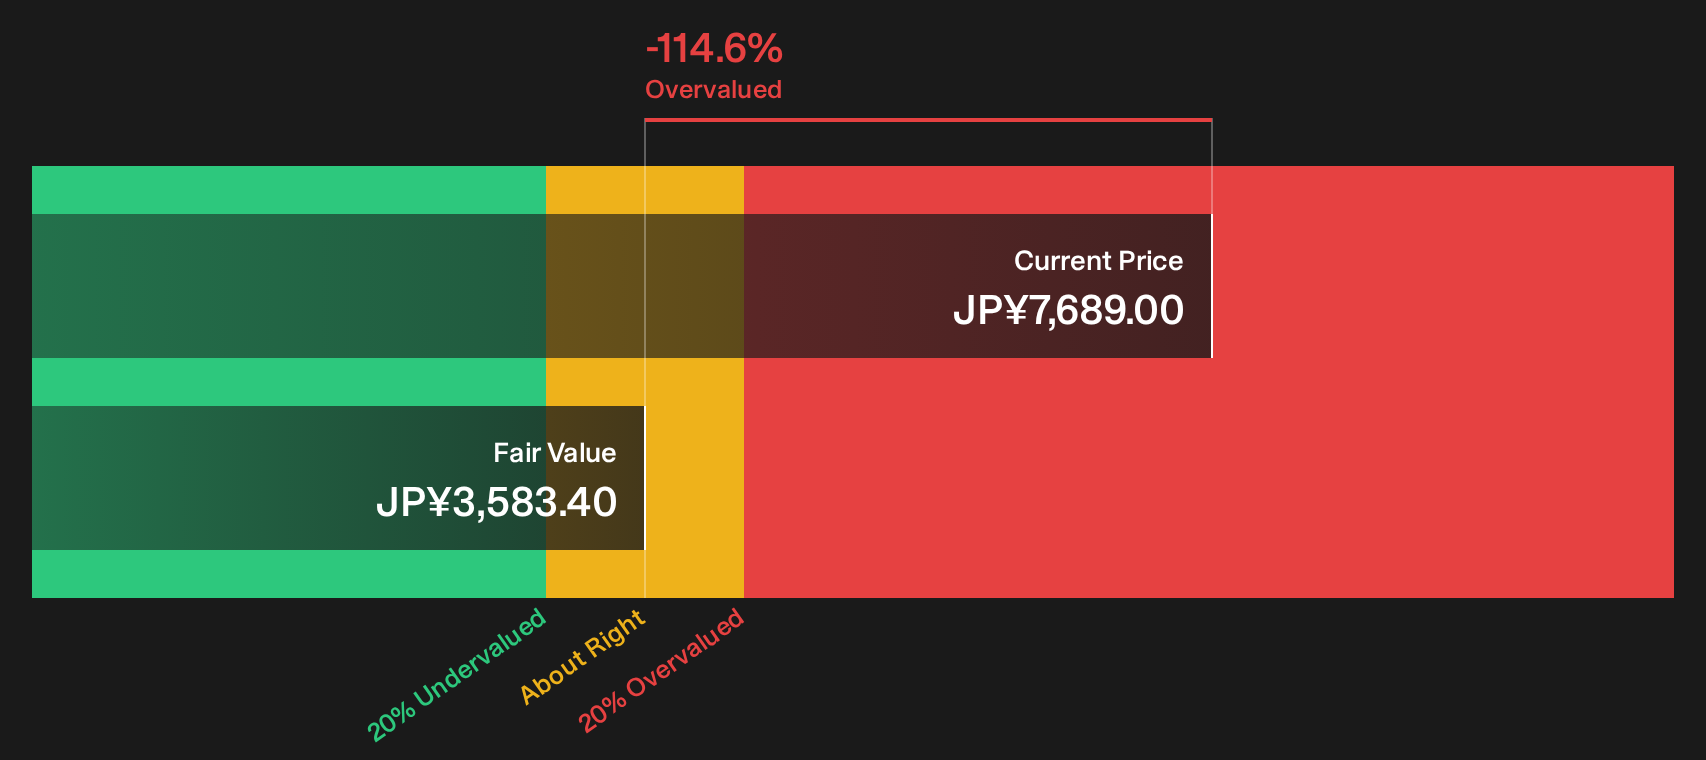
Simply Wall St performs a discounted cash flow (DCF) on every stock in the world every day (check out JEOL for example). We show the entire calculation in full. You can track the result in your watchlist or portfolio and be alerted when this changes, or use our stock screener to discover 19 high quality undervalued stocks. If you save a screener we even alert you when new companies match - so you never miss a potential opportunity.
Next Steps
Mixed views remain about whether JEOL’s current pricing really matches the risk and reward story on show here. Act quickly, review the numbers that matter most to you, and anchor your own stance with the help of our breakdown of 1 key reward and 1 important warning sign
Looking for more investment ideas beyond JEOL?
If JEOL has sharpened your focus, do not stop here. Broaden your watchlist with other clear setups that match your risk, income, and value preferences.
- Hunt for resilient cash generators with the 19 high quality undervalued stocks by focusing on stronger fundamentals where prices may not fully reflect them yet.
- Build a steadier income stream by scanning the 14 dividend fortresses which concentrates on higher yielding payouts with support from underlying financials.
- Prioritise capital protection by filtering for sturdier businesses through the 21 resilient stocks with low risk scores that emphasises stronger balance sheets and milder volatility profiles.
This article by Simply Wall St is general in nature. We provide commentary based on historical data and analyst forecasts only using an unbiased methodology and our articles are not intended to be financial advice. It does not constitute a recommendation to buy or sell any stock, and does not take account of your objectives, or your financial situation. We aim to bring you long-term focused analysis driven by fundamental data. Note that our analysis may not factor in the latest price-sensitive company announcements or qualitative material. Simply Wall St has no position in any stocks mentioned.
Have feedback on this article? Concerned about the content? Get in touch with us directly. Alternatively, email editorial-team@simplywallst.com