
- PRICING
- LIVE QUOTES
- LEARN
- HELP


EN
Is Pola Orbis Holdings (TSE:4927) Fully Valued After Its FTSE All World Index Removal?
Pola Orbis Holdings (TSE:4927) has been removed from the FTSE All-World Index in USD terms, an index change that can reshape trading flows, liquidity patterns and how some investors view the stock.
Recent trading has been resilient for Pola Orbis Holdings, with a 7 day share price return of 2.39% and a 90 day share price return of 9.19% at a latest share price of ¥1,390. At the same time, the 1 year total shareholder return of 6.38% contrasts with declines over the 3 and 5 year horizons. This indicates short term momentum has picked up, while longer term holders have still experienced weaker outcomes overall.
Spot opportunities others might be missing by scanning our hand picked 74 high quality undiscovered gems that, like Pola Orbis Holdings, can experience sentiment that shifts quickly around key index or liquidity changes.Pola Orbis Holdings has a long history, recognisable brands and fresh index-driven attention. The real tension now is simple: does ¥1,390 reflect that underlying business quality, or has the recent move left the shares mispriced?
Price-to-Earnings of 27.1x: Is it justified for Pola Orbis Holdings?
Pola Orbis Holdings is trading on a P/E of 27.1x at a last close of ¥1,390, which points to a richer valuation compared to several benchmarks.
The P/E ratio compares the current share price with earnings per share. For a cosmetics and personal products group like Pola Orbis Holdings, this measure gives a quick read on how much investors are willing to pay for each unit of current profitability.
Recent numbers show earnings grew 76.8% over the past year and net profit margins improved from 3.8% to 6.6%. Forecasts indicate earnings growth of 6.57% a year and revenue growth of 2% a year, both slower than the wider JP market and the JP Personal Products industry. That mix suggests the market is paying a premium P/E for Pola Orbis Holdings even though expected growth is more measured. It may also imply that the market is pricing in further progress on profitability, while the fair P/E estimate of 23.5x indicates a level that could be lower than the current valuation.
The gap is clear. The current 27.1x P/E is higher than the estimated fair P/E of 23.5x, the JP Personal Products industry average of 18.3x, and the peer average of 22.9x. That signals investors are assigning Pola Orbis Holdings a meaningfully stronger valuation than both its sector and peers, while the fair ratio suggests a level the market could move towards if expectations cool.
Explore the SWS fair ratio for Pola Orbis Holdings.
Result: Price-to-Earnings of 27.1x (OVERVALUED)
Still, any slip in earnings delivery or a shift in sentiment around Pola Orbis Holdings after its index removal could quickly challenge that premium P/E story.
Find out about the key risks to this Pola Orbis Holdings narrative.
Another View on Pola Orbis Holdings: Cash Flows Tell a Different Story
The earnings based P/E of 27.1x paints Pola Orbis Holdings as expensive, yet the SWS DCF model points in a different direction. On that cash flow view, the shares at ¥1,390 sit about 2.5% below an estimated value of ¥1,425.28, which frames the stock as modestly undervalued instead. That gap is small, but it raises a simple question: Which signal carries more weight for you, the premium earnings multiple or the gentler DCF discount?
Look into how the SWS DCF model arrives at its fair value.
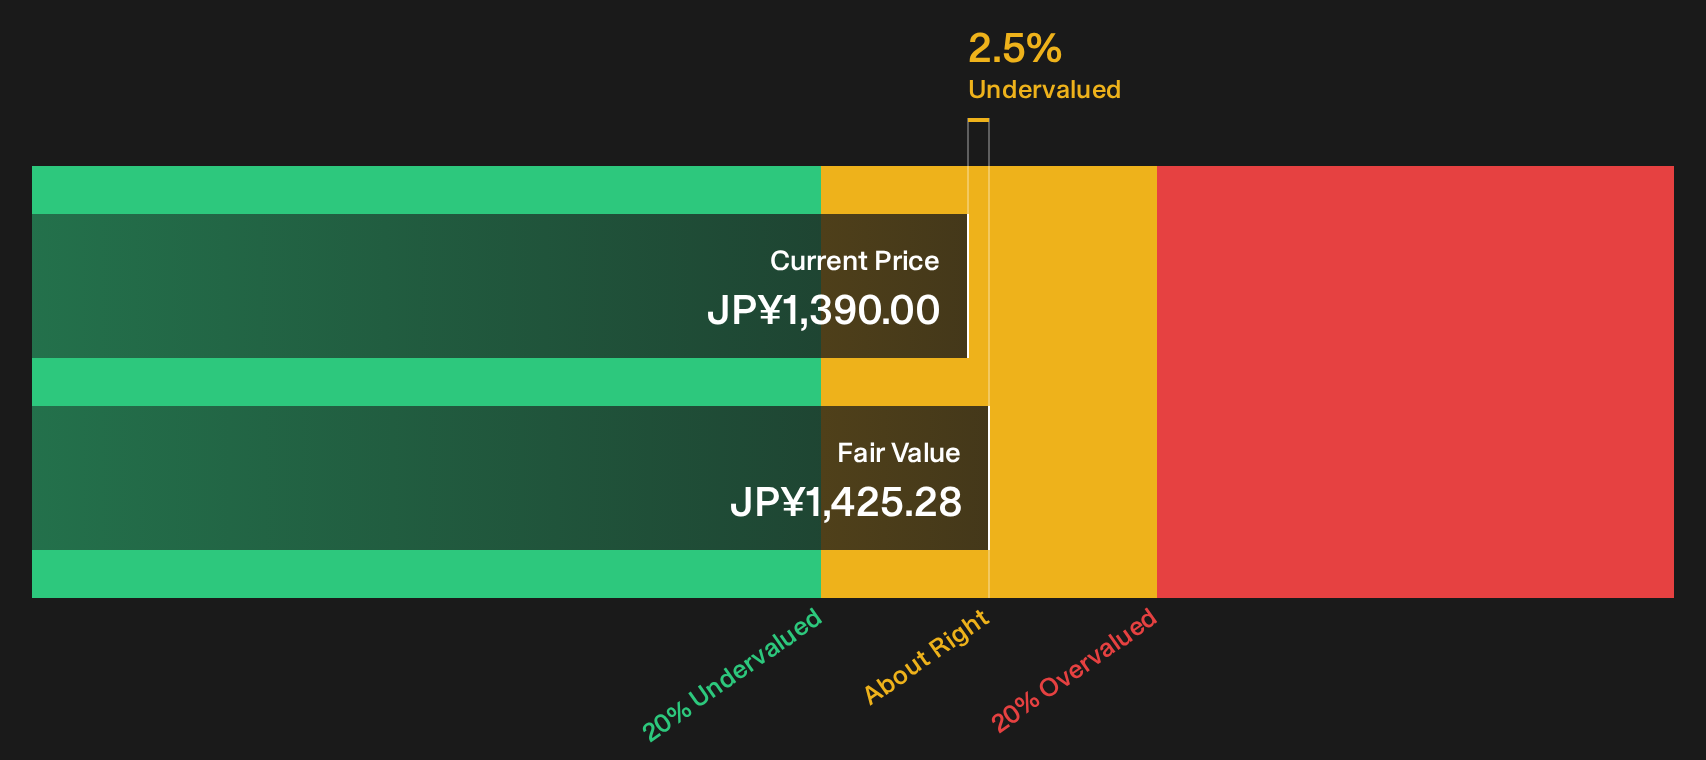
Simply Wall St performs a discounted cash flow (DCF) on every stock in the world every day (check out Pola Orbis Holdings for example). We show the entire calculation in full. You can track the result in your watchlist or portfolio and be alerted when this changes, or use our stock screener to discover 19 high quality undervalued stocks. If you save a screener we even alert you when new companies match - so you never miss a potential opportunity.
Next Steps
Sentiment around Pola Orbis Holdings is clearly split, so move quickly, review the numbers for yourself and weigh both sides of the story. To stress test your view against both concerns and potential upsides, start with our breakdown of the 3 key rewards and 2 important warning signs.
Looking for more ideas beyond Pola Orbis Holdings?
If Pola Orbis Holdings has sharpened your focus, now is the moment to widen your net and let data surface opportunities you might otherwise overlook.
- Target potential mispricing by scanning a curated set of quality companies trading below their estimated worth through the 19 high quality undervalued stocks.
- Build a steadier income stream by focusing on businesses in the 14 dividend fortresses that pair higher yields with more resilient payout profiles.
- Tilt your watchlist toward financial strength by filtering for companies in the list of solid balance sheet and fundamentals (22 results) before the crowd catches on.
This article by Simply Wall St is general in nature. We provide commentary based on historical data and analyst forecasts only using an unbiased methodology and our articles are not intended to be financial advice. It does not constitute a recommendation to buy or sell any stock, and does not take account of your objectives, or your financial situation. We aim to bring you long-term focused analysis driven by fundamental data. Note that our analysis may not factor in the latest price-sensitive company announcements or qualitative material. Simply Wall St has no position in any stocks mentioned.
Have feedback on this article? Concerned about the content? Get in touch with us directly. Alternatively, email editorial-team@simplywallst.com