
- PRICING
- LIVE QUOTES
- LEARN
- HELP


EN
Add This ETF to Your Watchlist to Profit from Rising Long-Term Rates
When it comes to hedging rising rates, or trying to profit from them, the ProShares Short 20+ Yr Treasury (TBF) has been my “go-to” for many years.
For over a decade, whenever 10-year and 30-year Treasury yields began climbing, TBF was not only an easy trade. It was easy to explain to my then-clients, when I was an advisor.
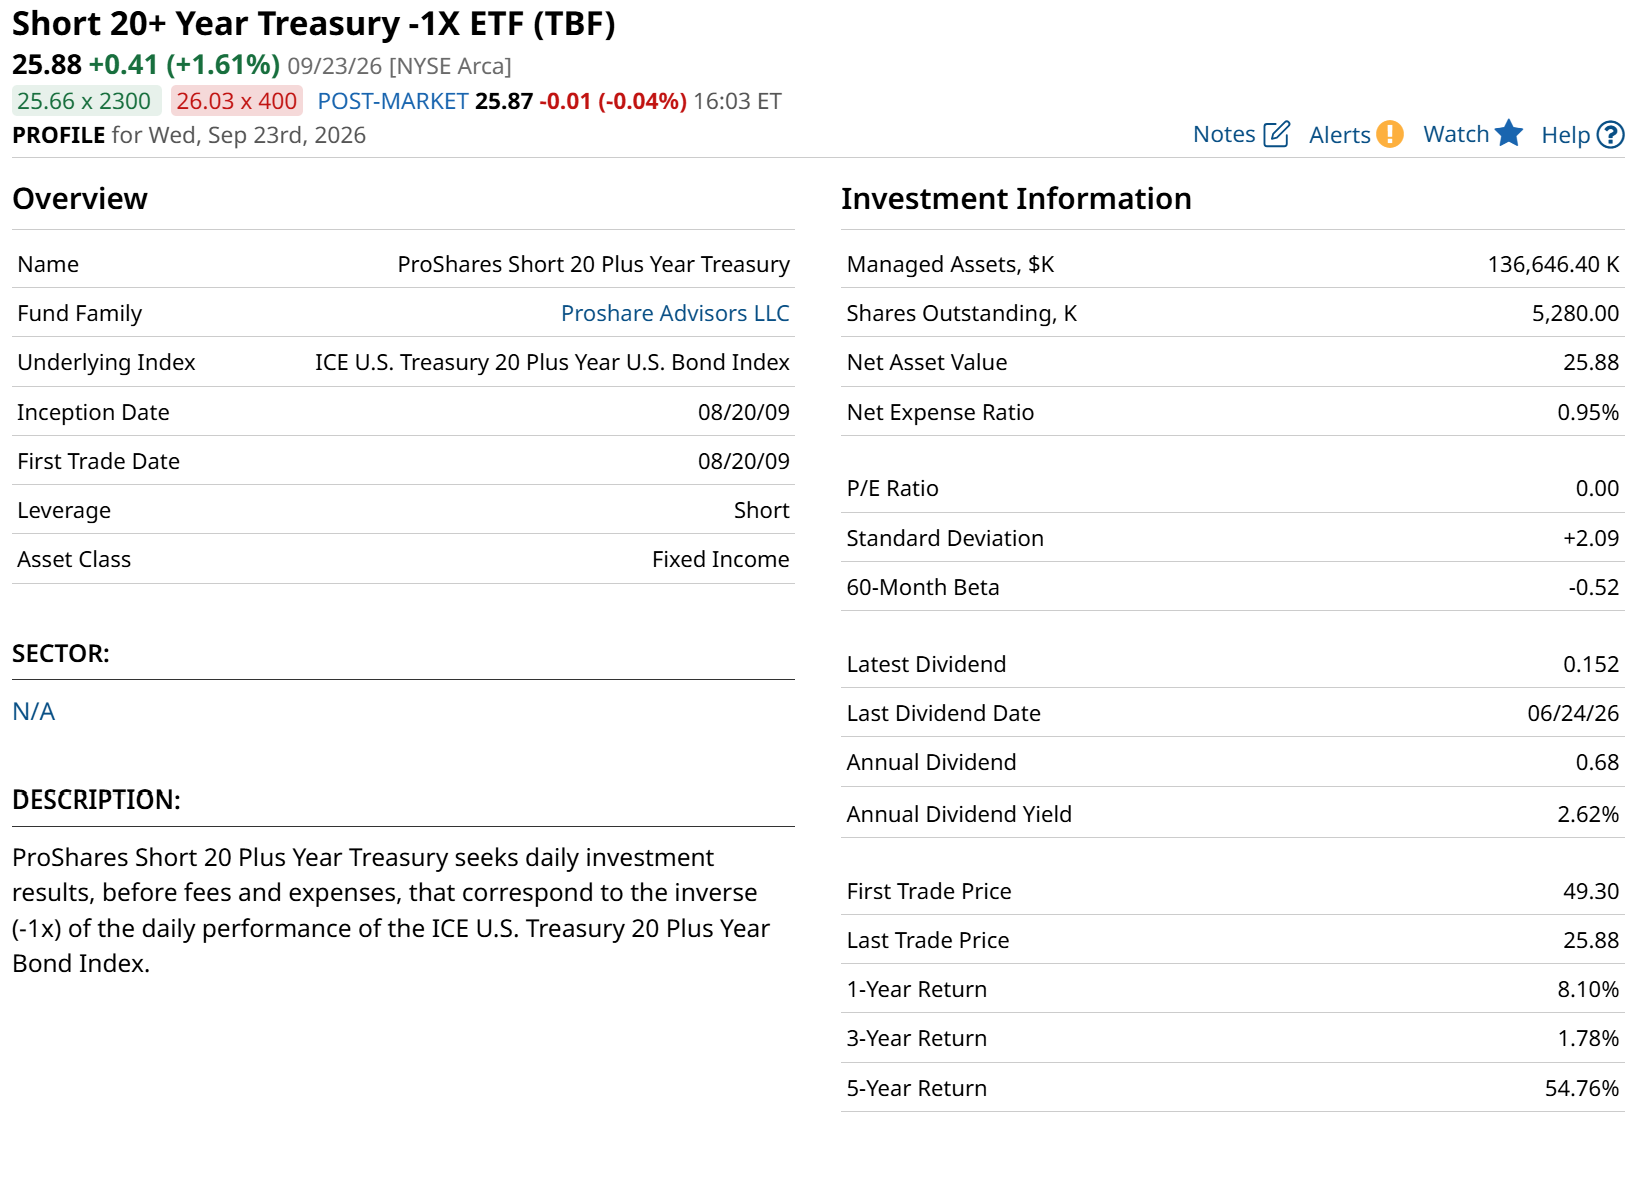
Because as it says above, it is designed to run in the opposite direction as the iShares 20+ Year Treasury Bond ETF (TLT). It even kicks up a little yield. So even while I shorted the long bond, I’d be earning a bit of income. And over the past five years, with rates going from near-zero to 5% across much of the yield curve, TBF has earned nearly 55% in total return.
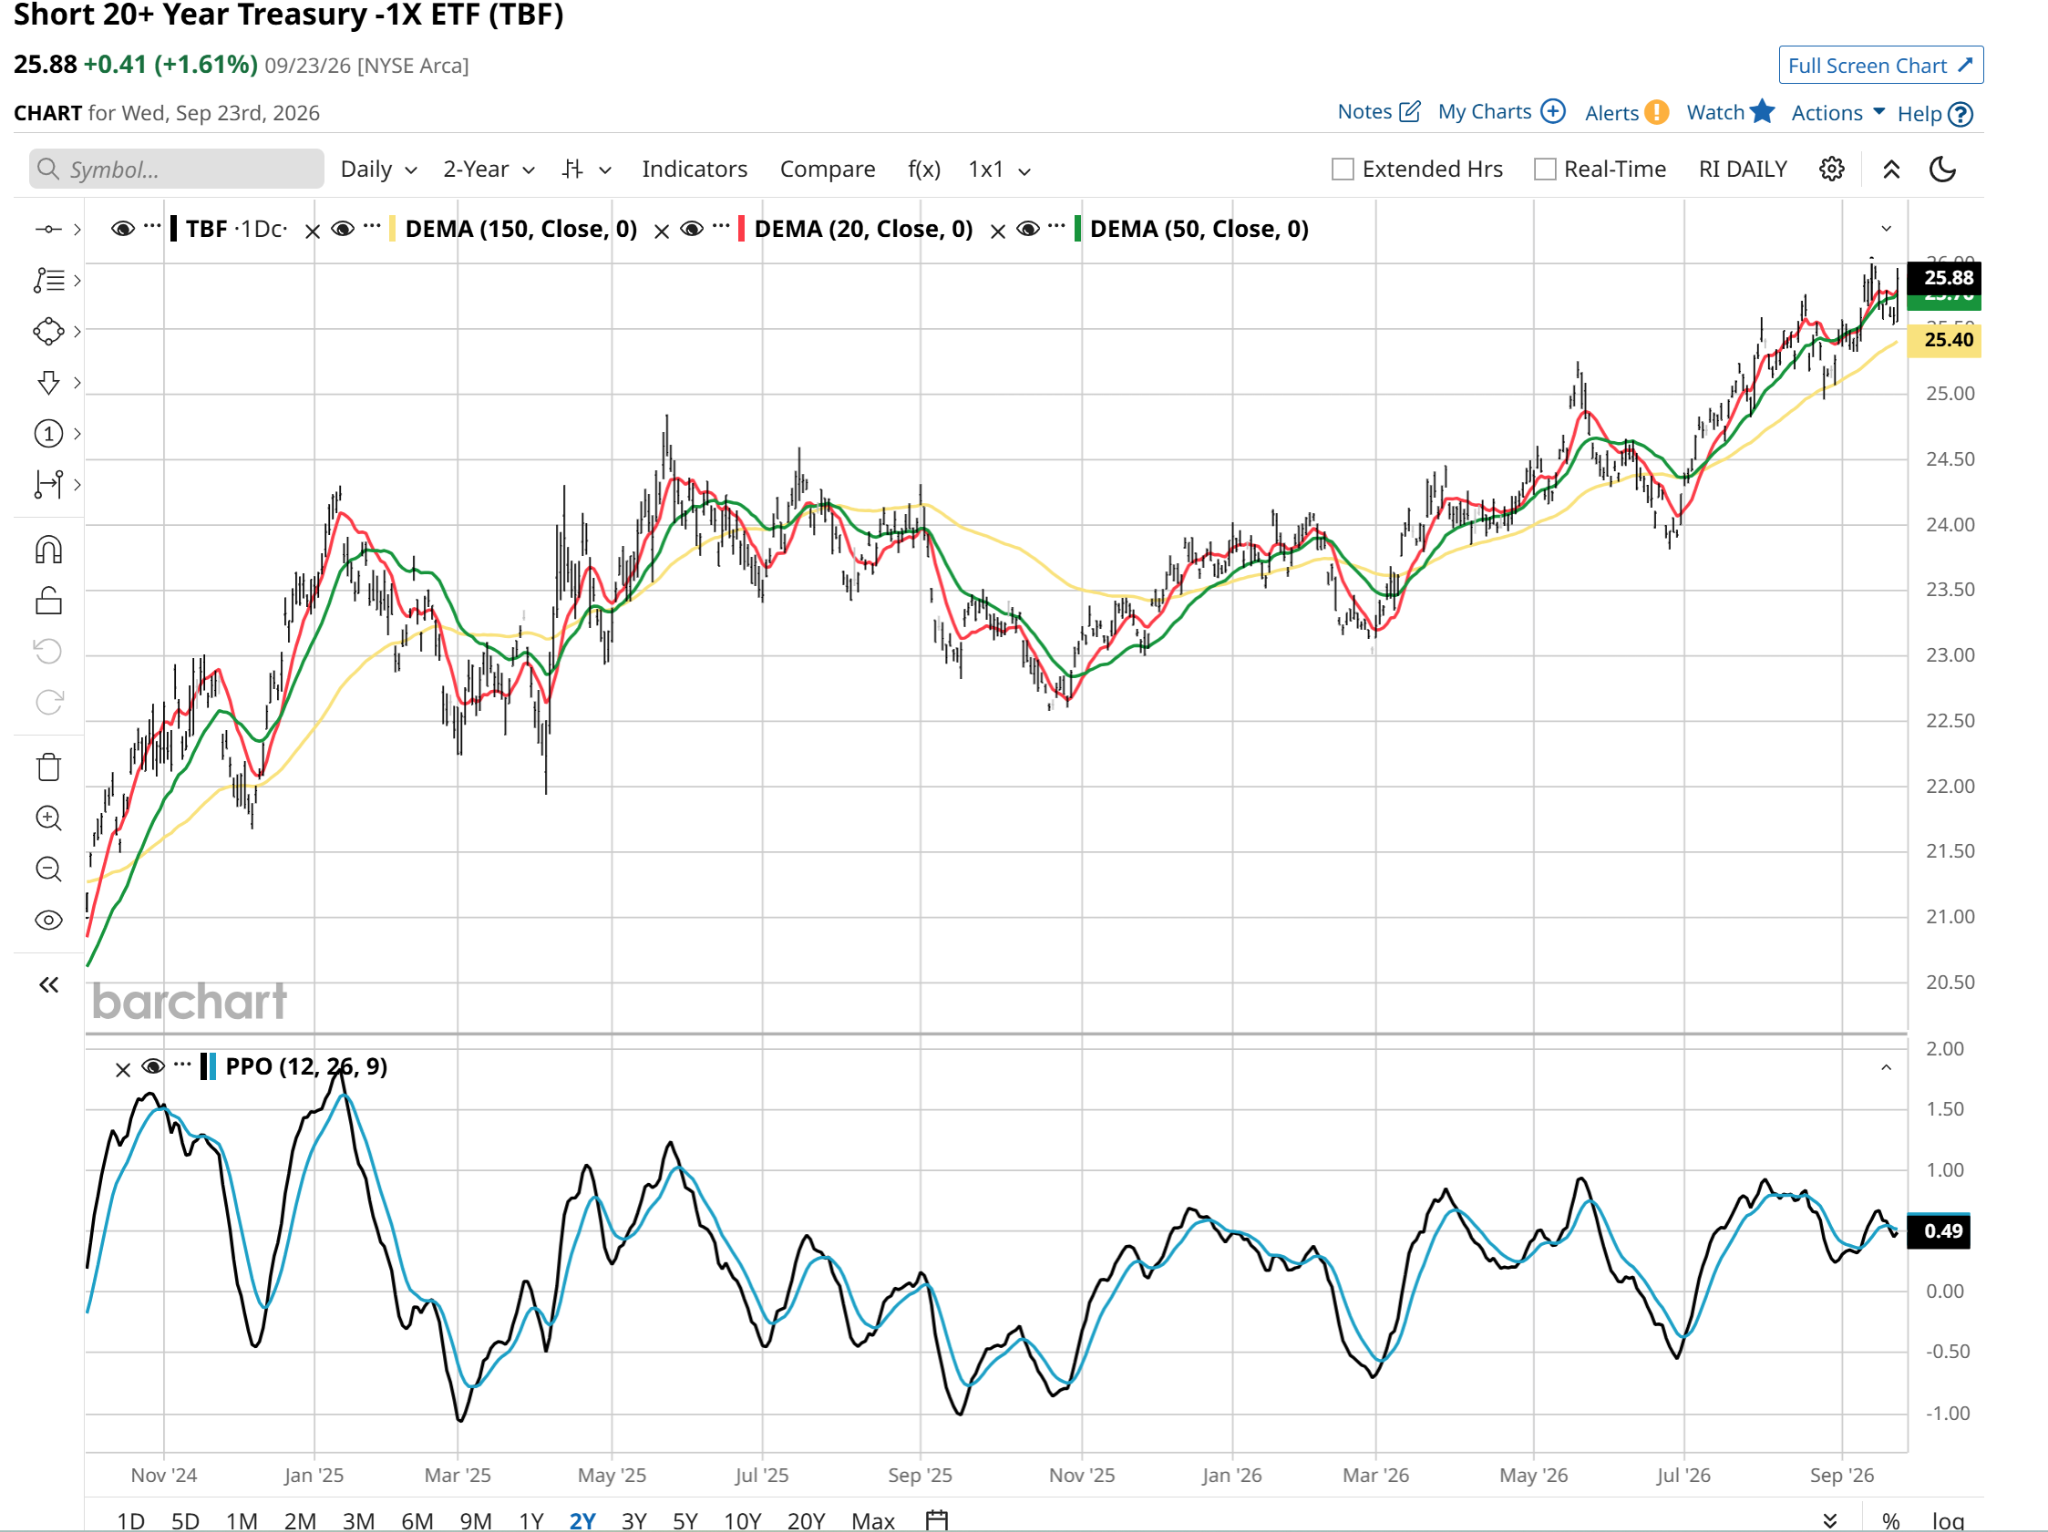
It is also worth noting that TLT lost 43% over that time. As I continue to stress here, while inverse ETFs can potentially be very tricky given the math of investment loss, that does not guarantee that holding an inverse ETF for weeks, months, or in this case as long as five years, can’t work out. TBF has earned well above -1x the return of TLT. Closer to -1.2x in fact.
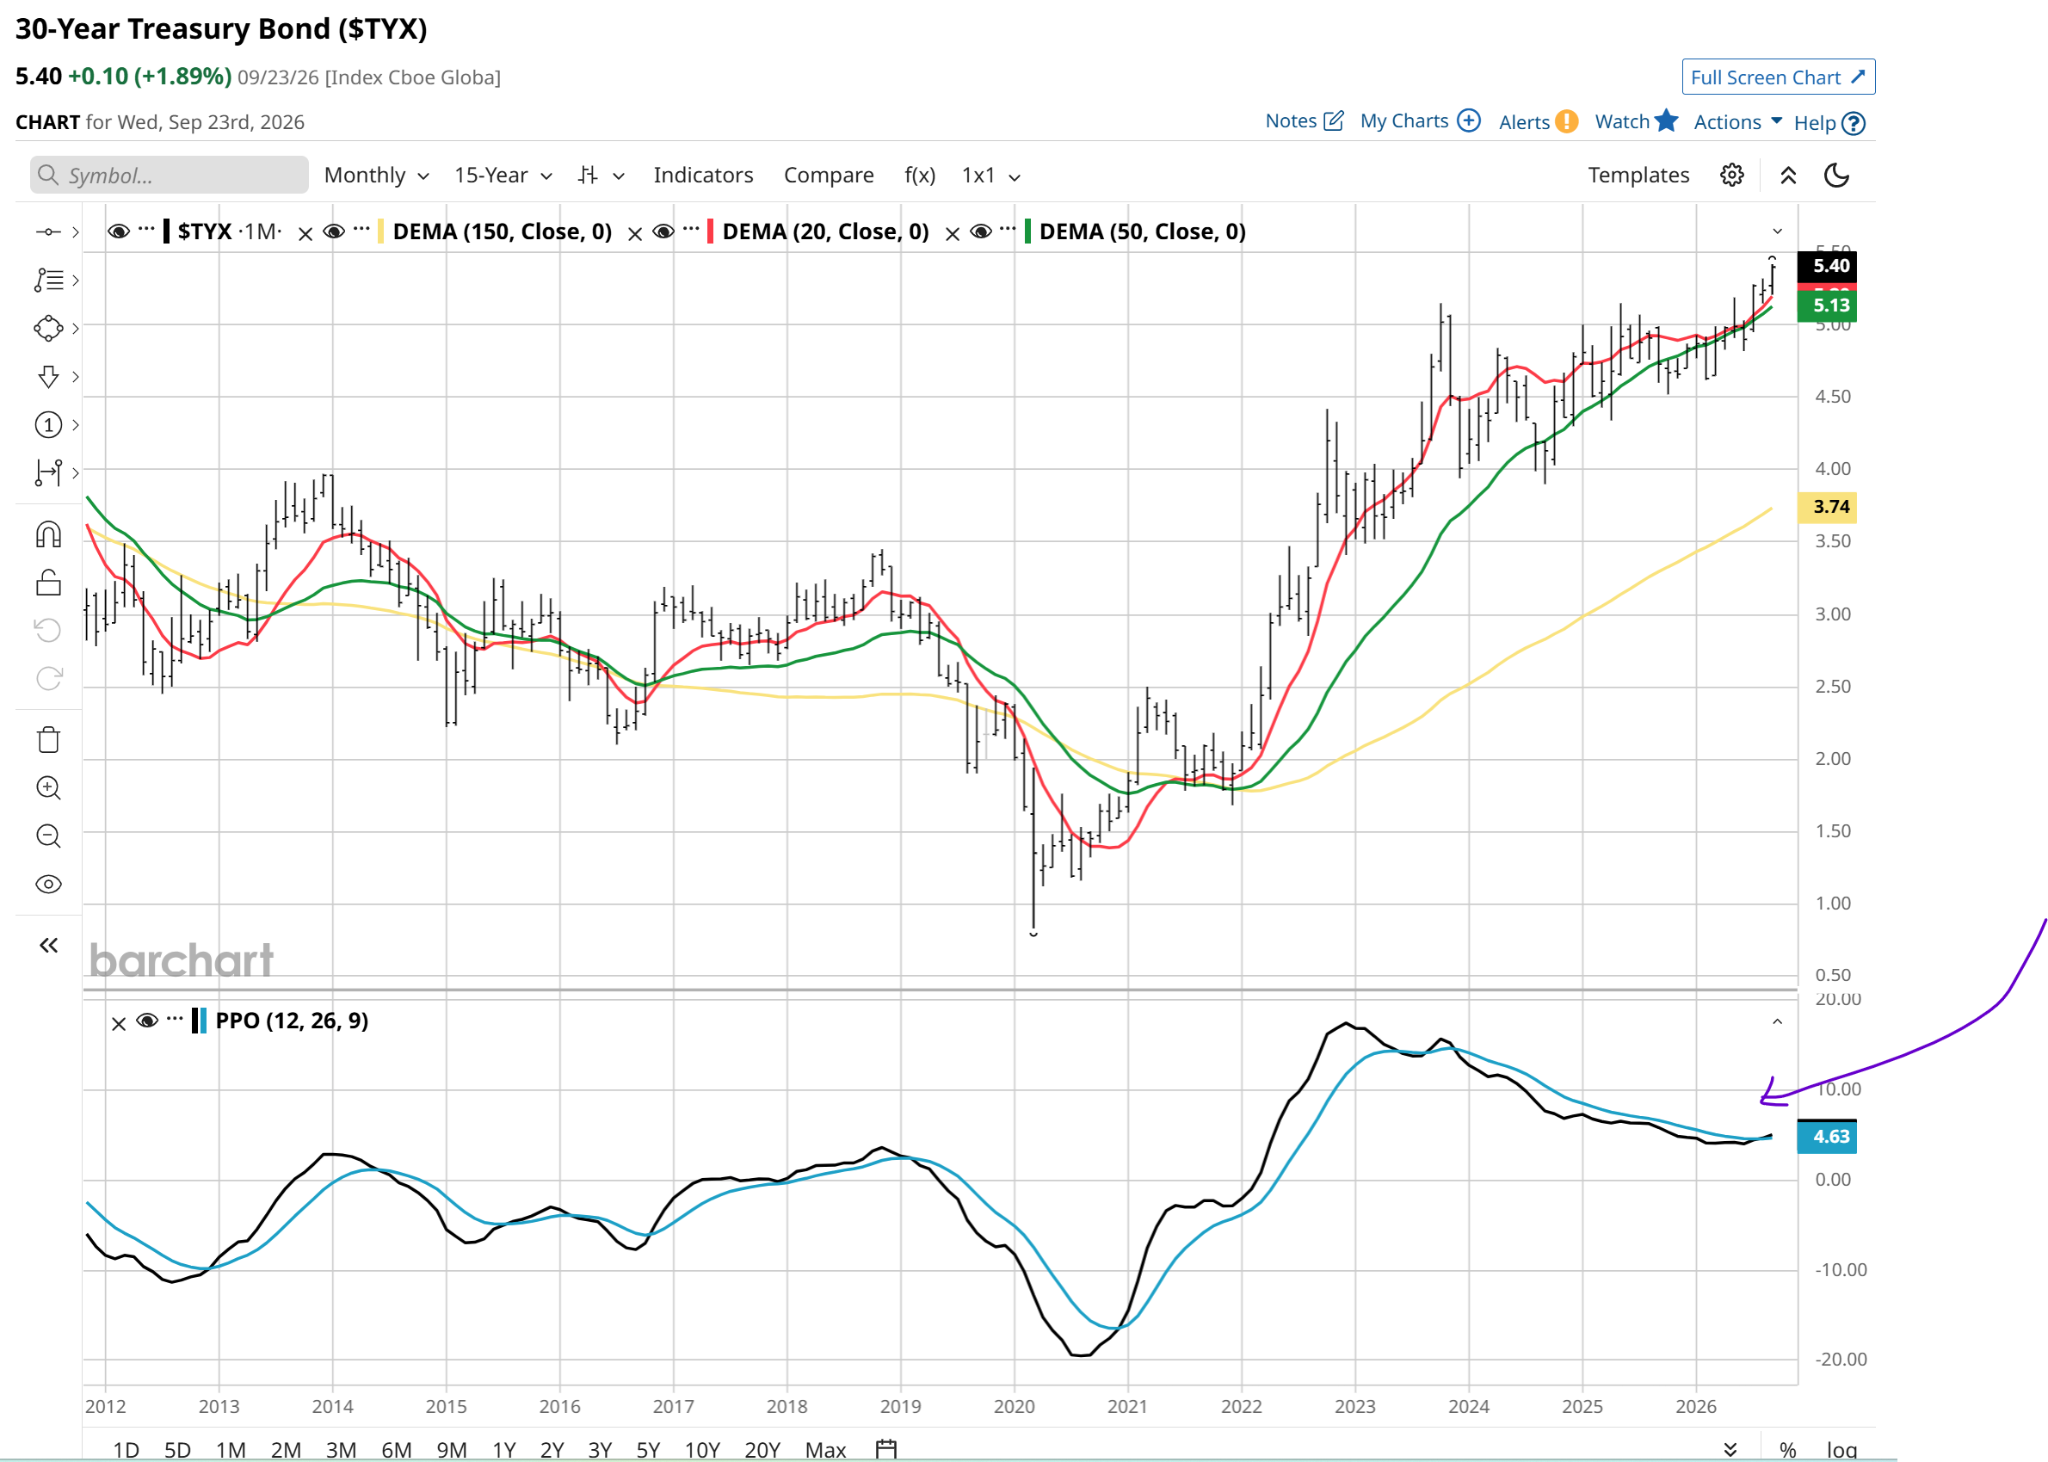
However, as this year has progressed, this technical picture of the 30-year bond emerged. I’ve drawn in that purple arrow to identify what is emerging as the potential disruptive force for the bond market. And quite possibly the stock market. That percentage price oscillator (PPO) momentum indicator matches the price chart above in terms of lifting off. Rates are moving higher, and the PPO is nearing a “crossover” to the upside. This means that 30-year yields might not be finished rising for this market cycle.
Why PFIX Is Another ETF to Consider to Profit from Higher Longer-Term Rates
The Simplify Interest Rate Hedge ETF (PFIX) is specifically the type of “jacked up” bond hedge I was looking for. Not simply because it is more volatile, and thus capable of producing more “bang for the buck” in sync with rising long-term bond yields.
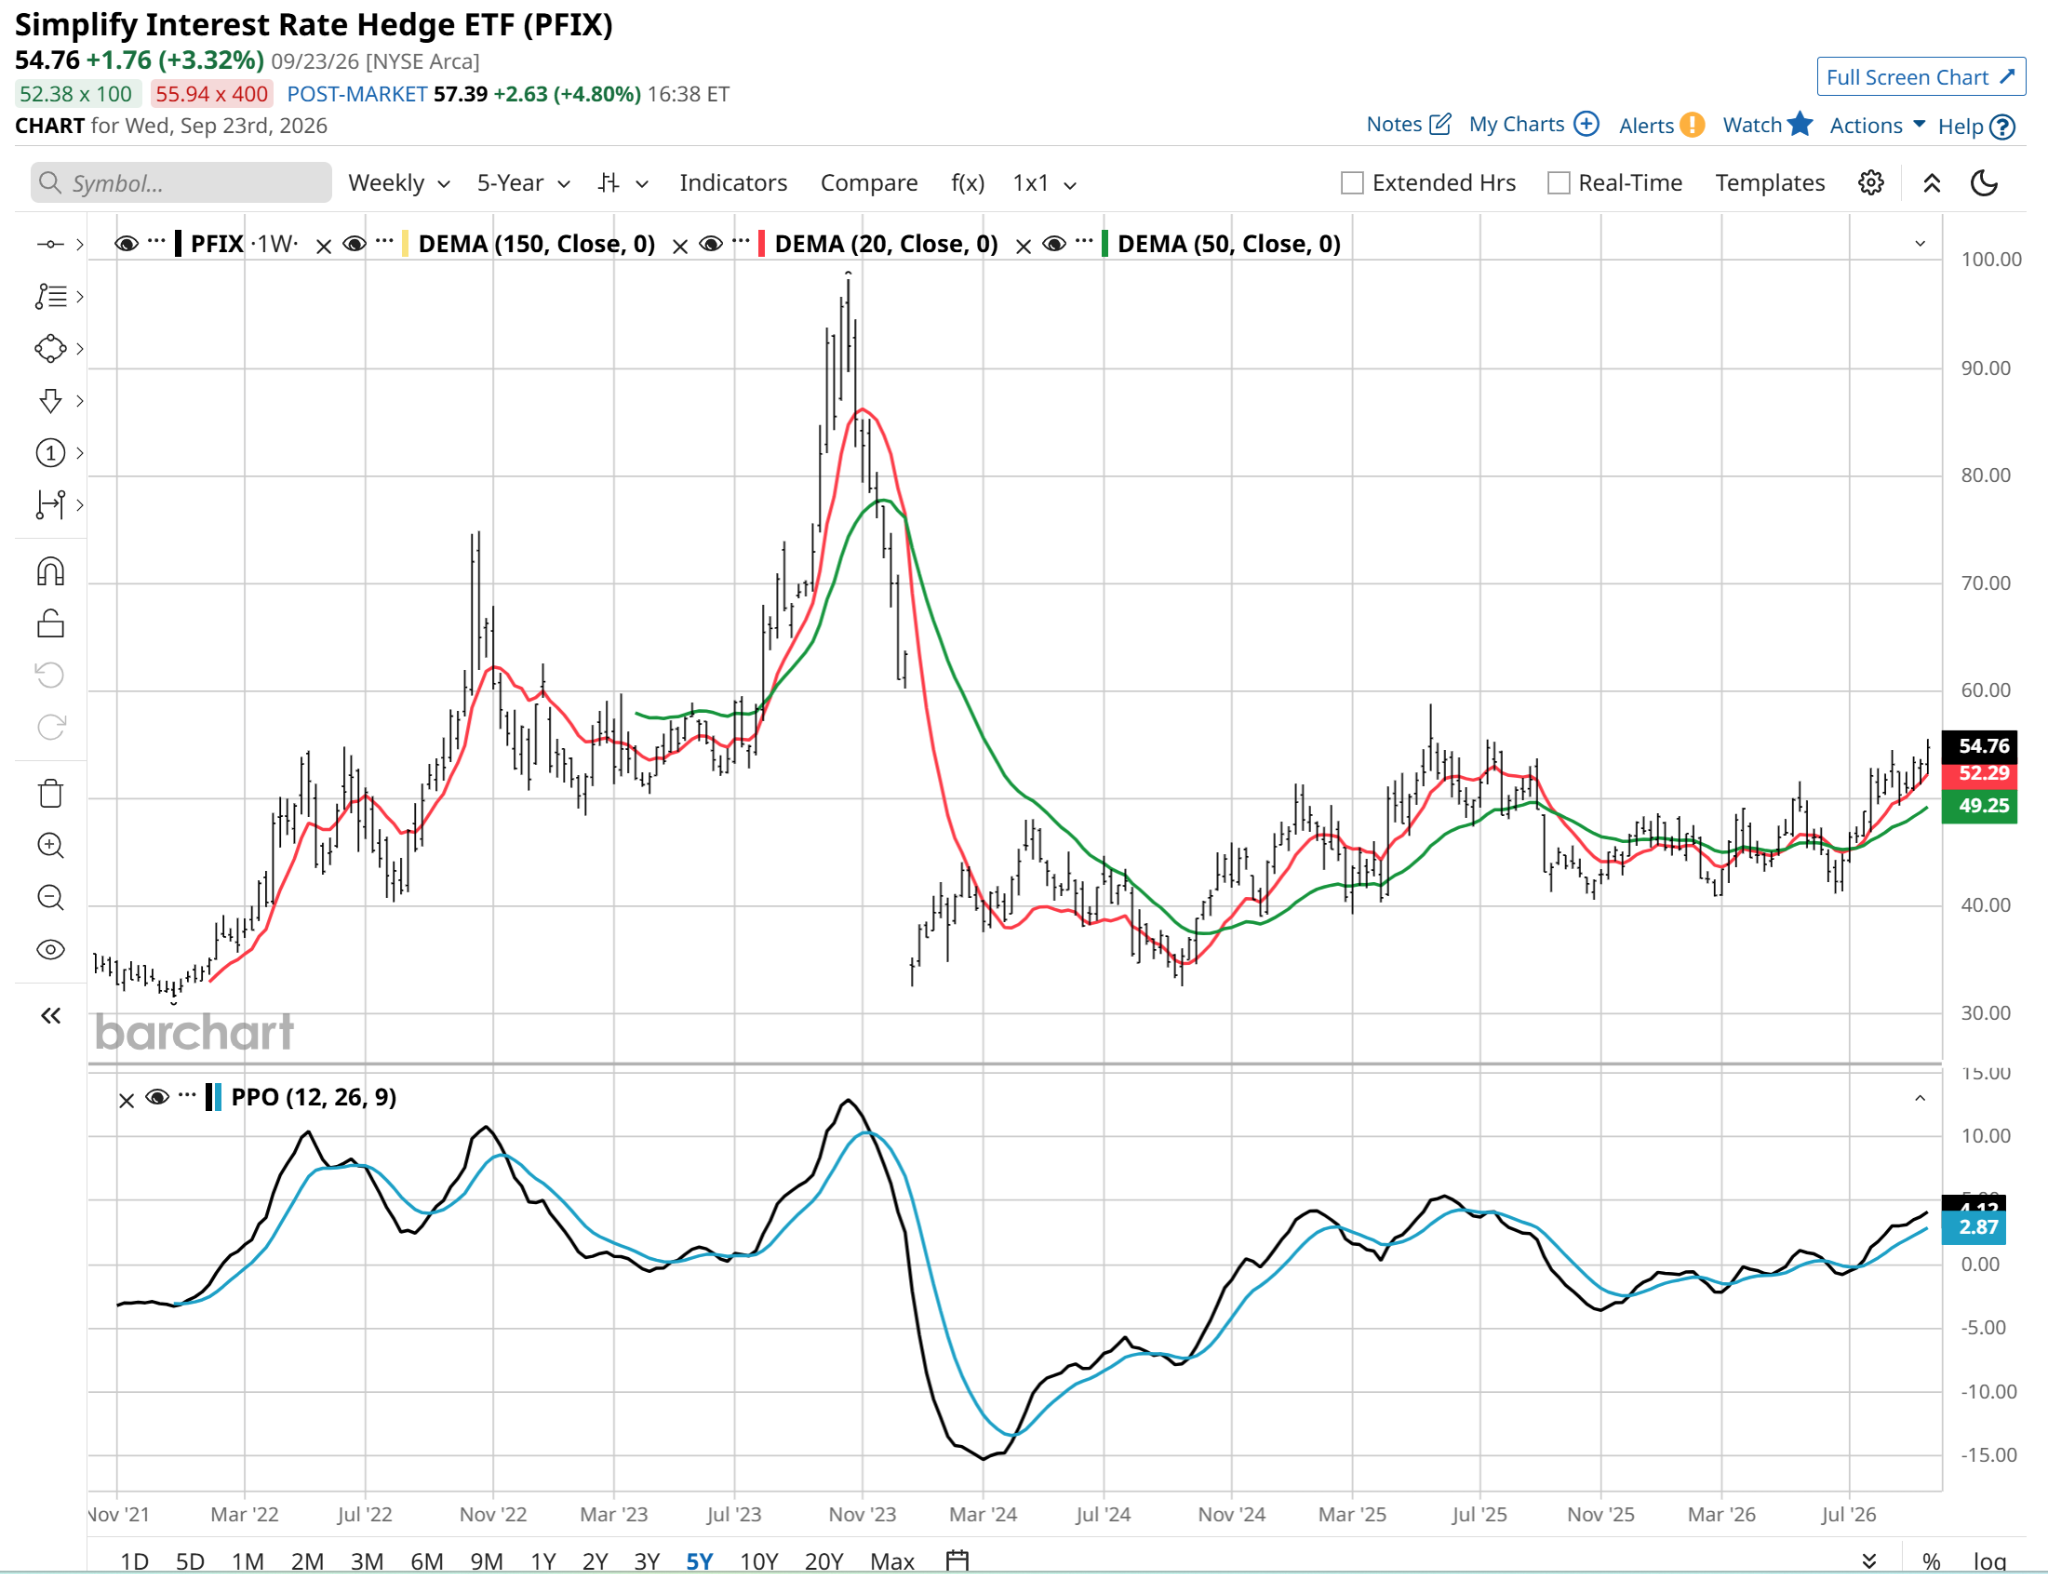
Instead of simply shorting Treasury bond futures line for line, or trading straight swap contracts, PFIX holds a base of short-term Treasury bills combined with a concentrated position in over-the-counter (OTC) “payer swaptions.” Those are options to enter interest rate swaps that pay fixed rates and receive floating rates.
Effectively, PFIX operates like holding a long-dated, deep-in-the-money put option on long-term U.S. Treasuries. I regularly use TLT put options to hedge my zero-coupon U.S. Treasury laddered portfolio.
However, in my more recent creation, the “Hedged Bond” live model portfolio for subscribers, where they can follow my trades, I only use ETFs.
What’s better than ETFs? ETFs that take advantage of the low-investment amount and uncapped potential return of some underlying security! In this case, the long bond.
As long-term yields surge, PFIX’s rate sensitivity accelerates. During sudden yield spikes, this ETF can generate explosive gains that far outpace inverse funds. Naturally, that whipsaw works in both directions.
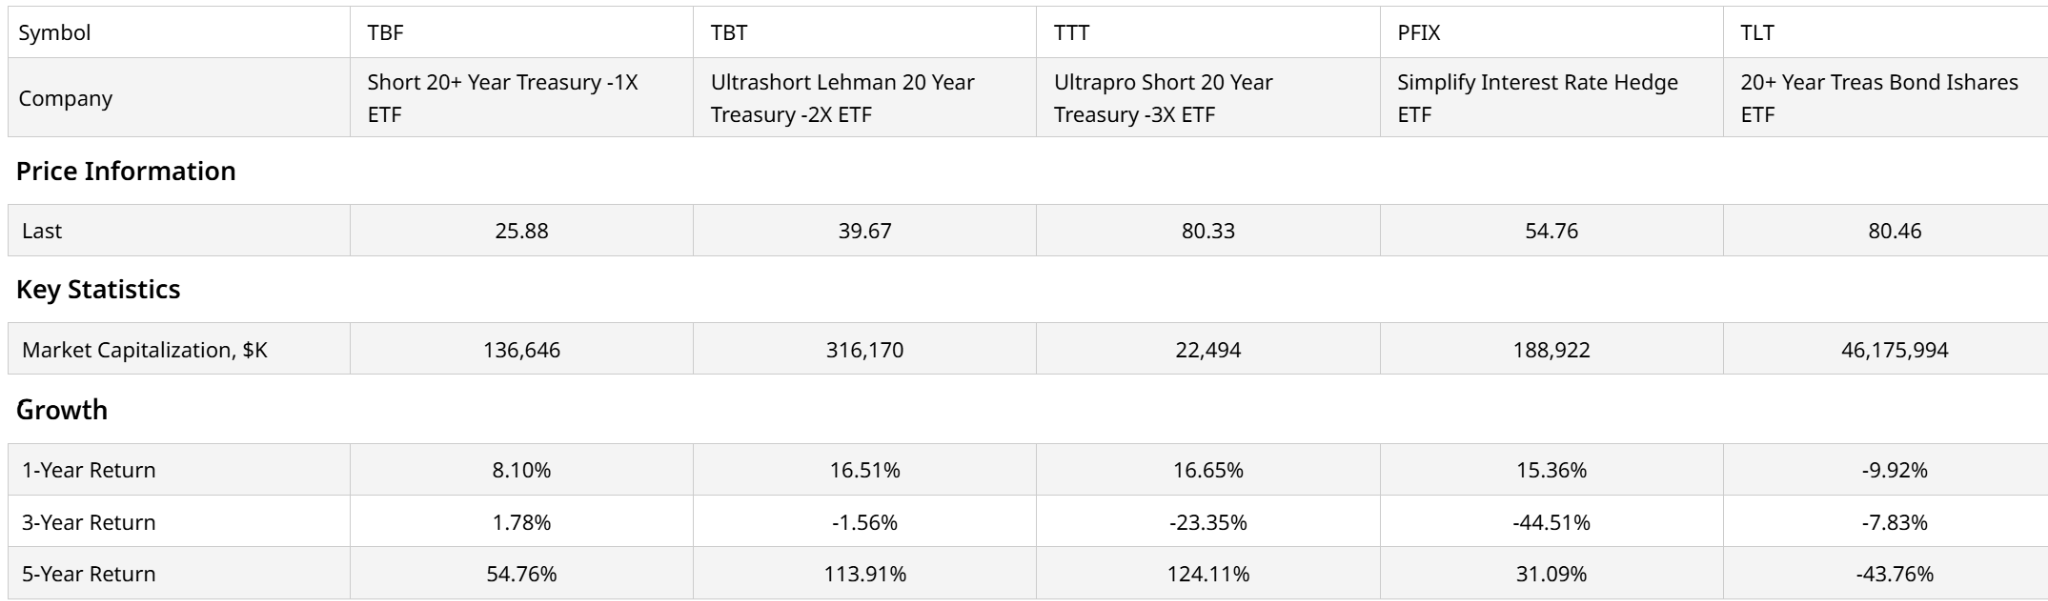
So depending on the time frame we look at, we can see that PFIX is no better or worse than the Ultrashort Lehman 20 Year Treasury -2X ETF (TBT) and the Ultrapro Short 20 Year Treasury -3X ETF (TTT) (1-year returns). And it can get pummelled during extended periods of falling rates, sort of like a put option does. So there’s a tradeoff for sure.
This highlights why I am so insistent that this era, complete with an algorithmically driven and index-crazy stock market, higher but uncertain interest rates and an oil price situation that changes by the moment, there’s at least one new investment “rule.”
Learn How to Hedge the Risk You Take
ETFs can be a player there. However, this is not about ETFs, and it is not a one-size-fits-all decision. My point is not “do this” or “do that.” It is “learn what you wish to learn, learn it well, and have whatever you define as the right set of tools for your personal objectives.”
Me? I’m 40 years into this, 33 of them directly or indirectly making investment decisions that other people could see, learn from, and copy to their heart’s content. Including now. So in that role, I want the full flexibility to consider many solutions. Every one of the five ETFs you see in that table above is part of my “arsenal.” Which ones are used at any particular time depends on what the charts tell me, and how those positions complement the rest of my existing portfolio.
This is not for show and tell. In these markets, I think we are all playing for “keeps.”
Need a reminder? In 2022, stocks and bonds both fell hard, together. That brought the total return of the iShares Core 60/40 Balanced Allocation ETF (AOR), the 60/40 portfolio ETF, down to around $40 a share. It started 2018 at $38. That’s a 5% total gain (not annualized) over nearly five years.
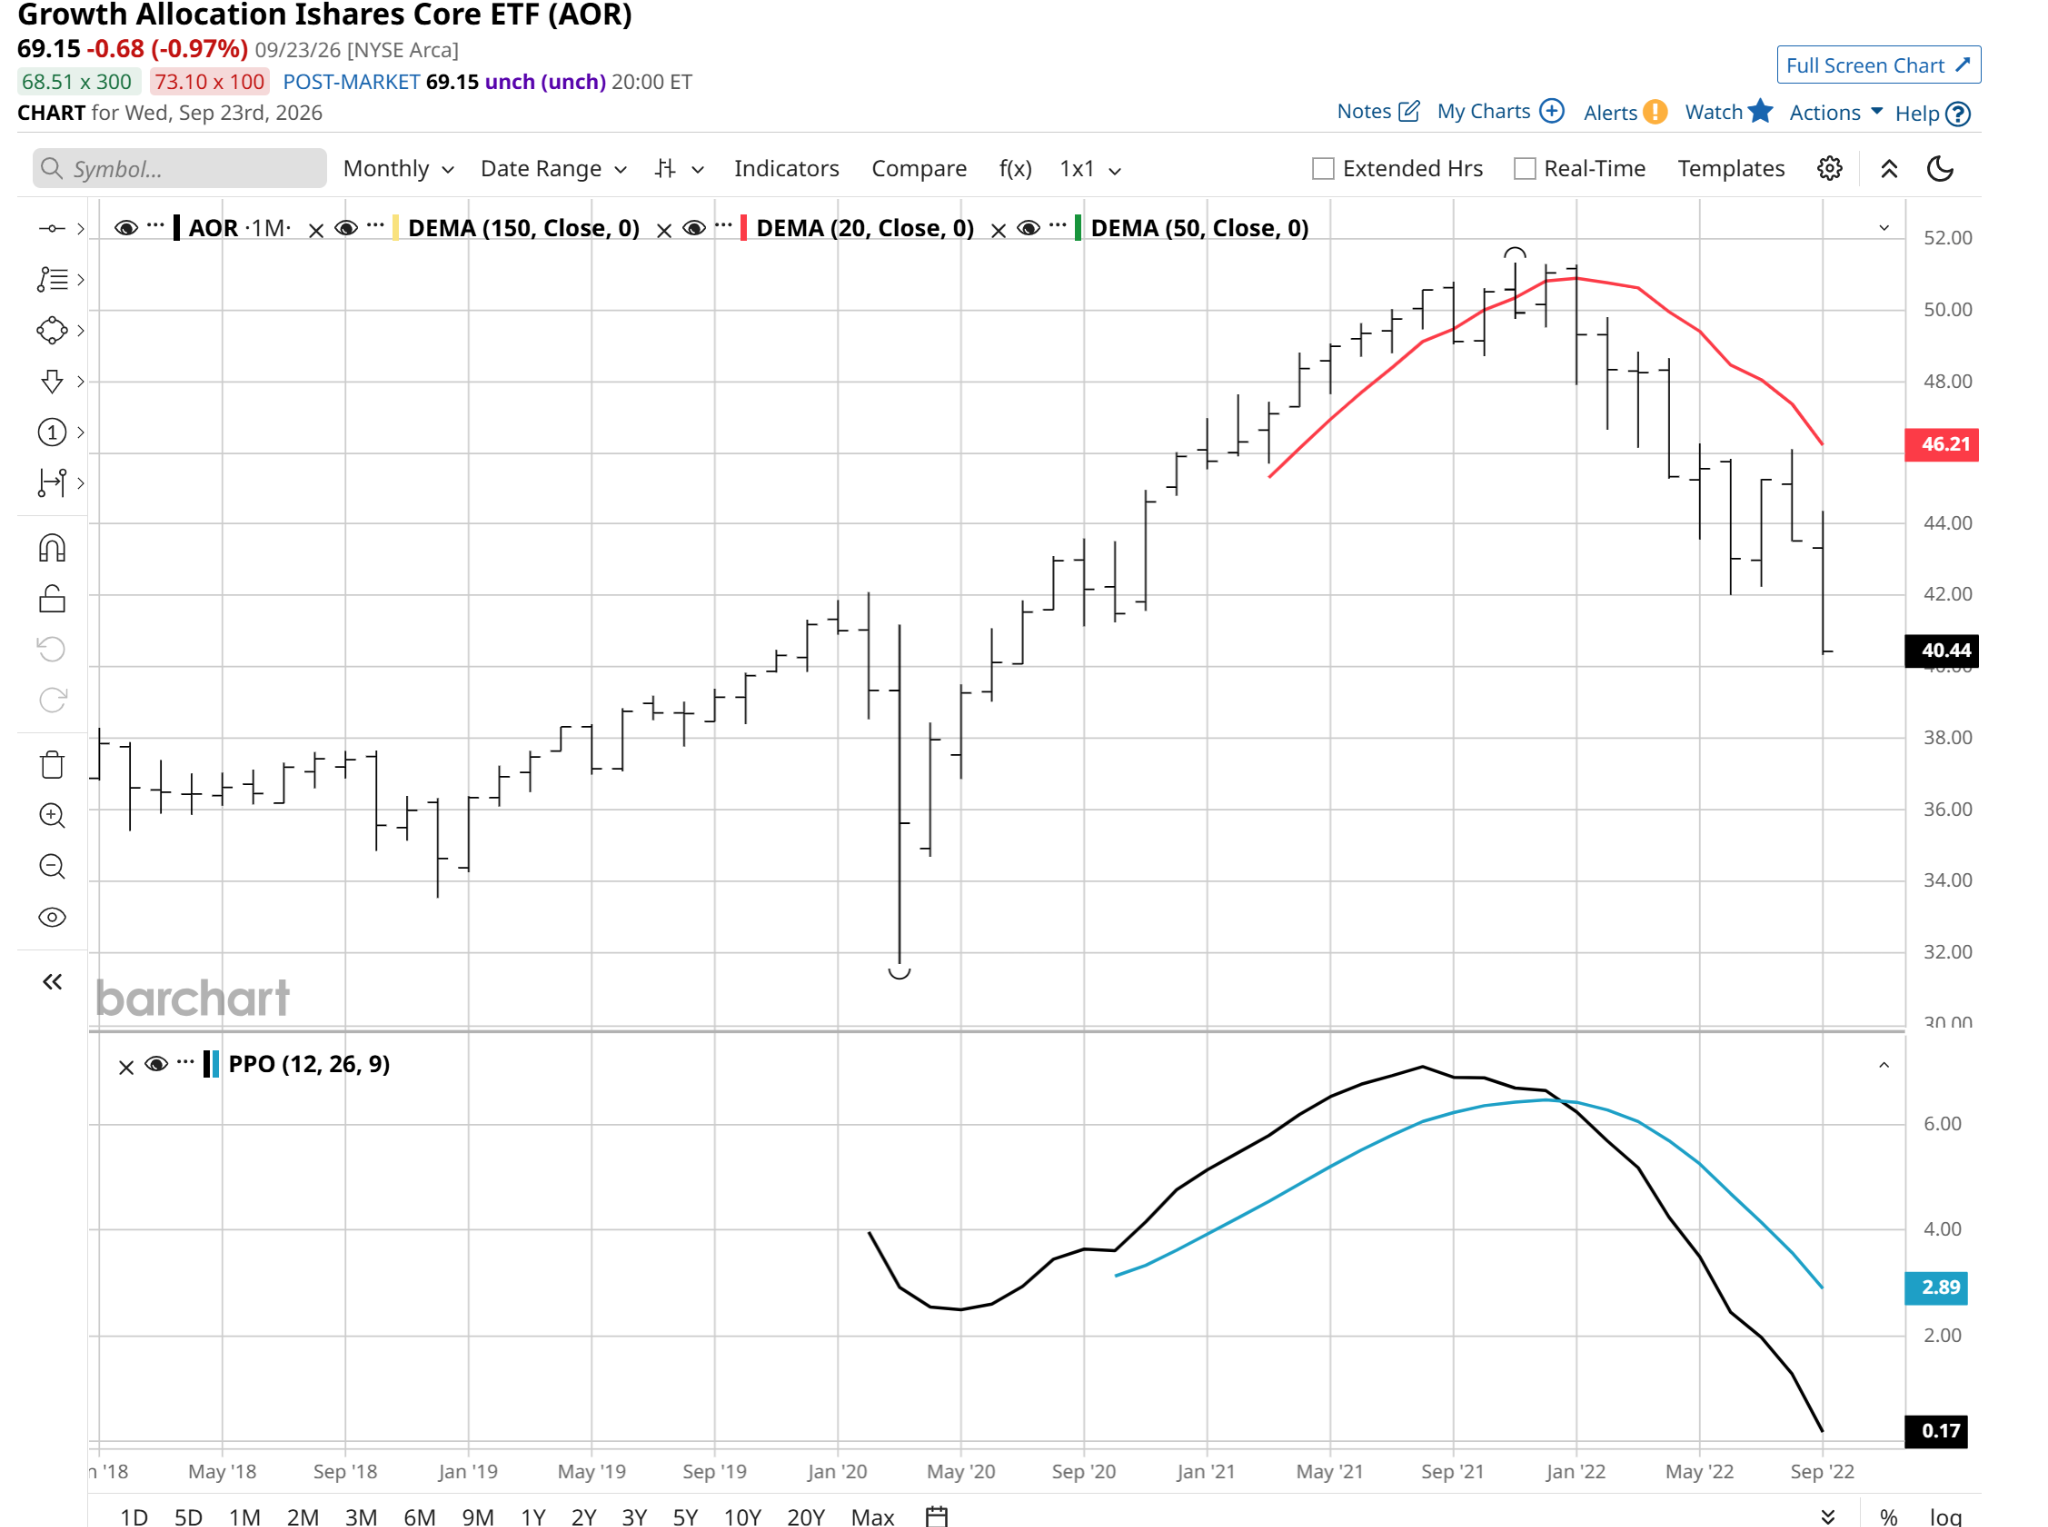
I am 62 years old. I am the last batch of Baby Boomers. As I see it, going “0” for five years now is simply unacceptable. It sounds great to be a “long-term investor.” But to me, the best way to do that is to not be forced into it because you spend so much time making up for periods of steep loss, or near-zero total returns.
Rob Isbitts is a semi-retired CIO, former fiduciary investment advisor, and Barchart columnist. Check out his other work at ETFYourself.com (featuring the Fresh Charts weekly trading post), and ROAR.PiTrade.com, helping investors to better-manage their own portfolios.
On the date of publication, Rob Isbitts did not have (either directly or indirectly) positions in any of the securities mentioned in this article. All information and data in this article is solely for informational purposes. For more information please view the Barchart Disclosure Policy here.