
- PRICING
- LIVE QUOTES
- LEARN
- HELP


EN
Fujikura (TSE:5803) Files A ¥60 Billion Bond Shelf, Is The Stock Too Expensive?
Fujikura (TSE:5803) is back on investor watchlists after the company filed a ¥60 billion bond shelf registration, a funding move that places its capital structure and future spending plans under closer scrutiny.
Recent trading tells a mixed story. Fujikura’s share price has climbed strongly year to date with a 62.19% share price return, supported by a very large 5 year total shareholder return of more than 50x. However, momentum has cooled with the stock down 9.35% over the past month as investors weigh the new ¥60 billion bond shelf against that longer track record.
Scan how Fujikura compares with other industrials preparing for big funding moves by checking out our hand picked list of solid balance sheet and fundamentals (22 results).
Bulls see Fujikura using fresh debt to fund growth and justify a big rerating. Bears worry the ¥60 billion shelf risks overreach at today’s price. Which side does current valuation support?
Preferred P/E of 40x on Fujikura: Is it justified?
Valuation looks stretched on simple earnings metrics, with Fujikura trading on a P/E of 40x at a last close of ¥4,986 while some models and peer checks point to a lower implied level.
The P/E ratio compares the current share price to earnings per share and helps you see how much investors are paying for each unit of profit. For a business like Fujikura, which operates across telecoms infrastructure, electronics, automotive components and power systems, P/E is often used as a shorthand for how much faith the market has in future profitability and capital allocation.
There is a split message in the data. On one side, forecasts point to earnings growth of 16.5% per year and revenue growth of 11% per year, both higher than the wider JP market, and recent earnings growth of 99.6% paired with a 33% Return on Equity and improving net profit margins to 15.7% reinforce that the recent performance has been strong. On the other side, the stock is described as expensive versus both the JP Electrical industry average P/E of 13.8x and a peer average of 23.6x, while the SWS DCF model future cash flow value estimate of ¥3,462.21 per share sits well below the current ¥4,986 price, which points to a richer valuation than that cash flow model supports.
Compared with the sector, the gap is wide. A 40x P/E against a 13.8x industry level and 23.6x peer average signals that the market is paying a much higher multiple for Fujikura than for similar electrical stocks, and the fair P/E estimate of 41.2x suggests only a small difference between where the ratio is and where that regression based fair ratio could move, even if the underlying share price does not change much.
Explore the SWS fair ratio for Fujikura.
Result: Preferred multiple of P/E 40x (OVERVALUED)
Still, the ¥60 billion bond shelf and a rich 40x P/E could bite if execution slips or debt funded projects fail to generate sufficient returns.
Find out about the key risks to this Fujikura narrative.
Another view on Fujikura’s value
There is a different read when shifting from the headline P/E to the SWS DCF model. On that framework, Fujikura’s future cash flow value is estimated at ¥3,462.21 per share, which sits below the current ¥4,986 level and points to an overvalued picture through this lens. That gap raises a simple question for investors: Which signal should carry more weight, earnings multiples or cash flows?
Look into how the SWS DCF model arrives at its fair value.
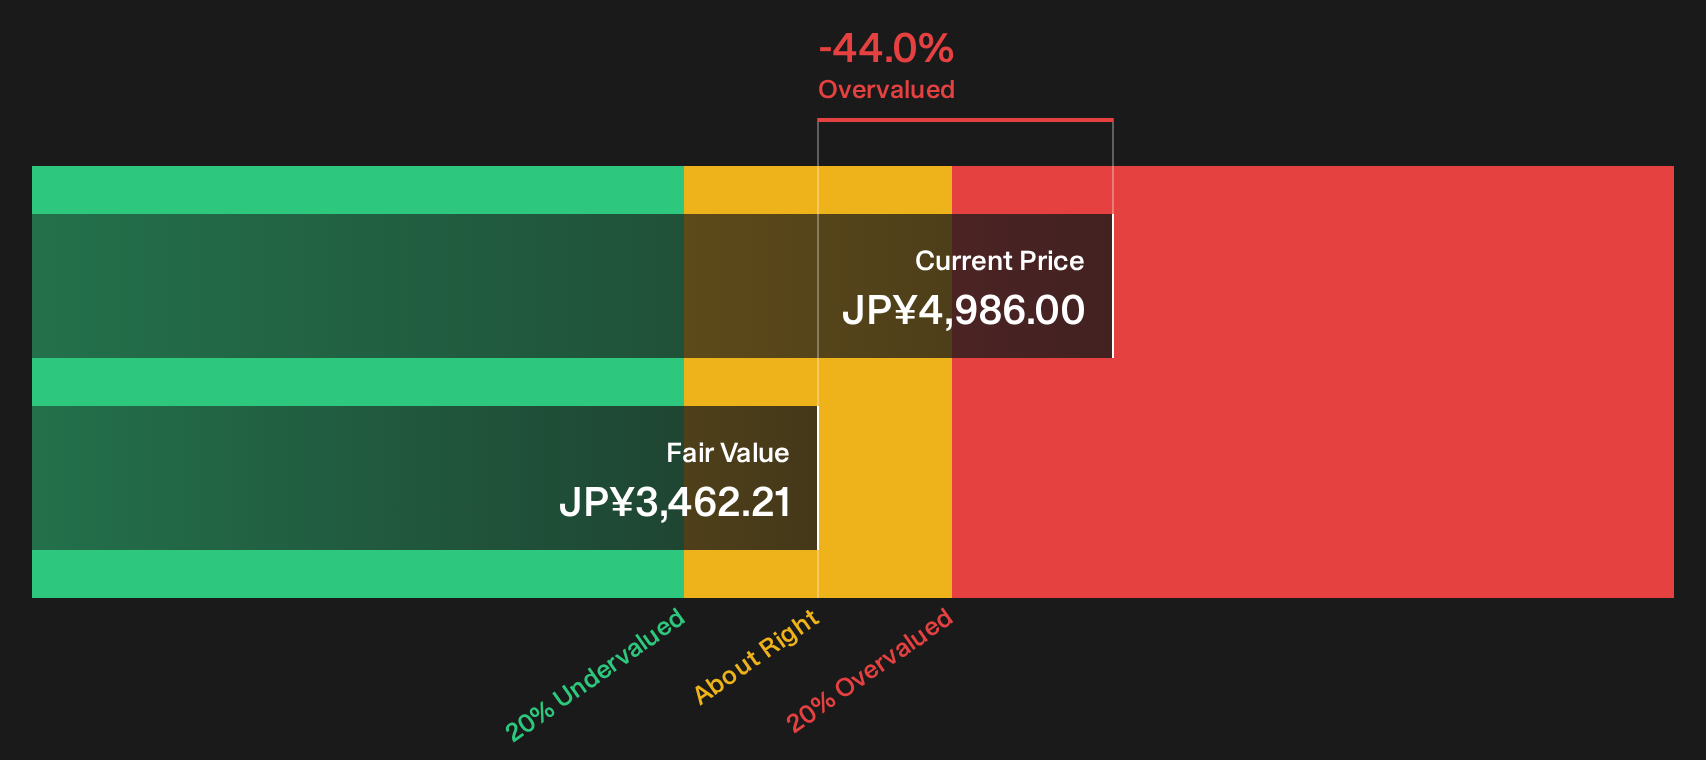
Simply Wall St performs a discounted cash flow (DCF) on every stock in the world every day (check out Fujikura for example). We show the entire calculation in full. You can track the result in your watchlist or portfolio and be alerted when this changes, or use our stock screener to discover 18 high quality undervalued stocks. If you save a screener we even alert you when new companies match - so you never miss a potential opportunity.
Next Steps
Mixed messages on Fujikura’s value and funding plans can feel messy. If you want to move fast and ground your own stance in the numbers, weigh the 2 key rewards and 1 important warning sign.
Looking for more Fujikura sized investment ideas?
If Fujikura has sharpened your focus on pricing, risk and balance sheets, do not stop here. Use screeners to explore other opportunities in the market.
- Target value with quality by reviewing the 18 high quality undervalued stocks that align strong fundamentals with appealing pricing.
- Protect your downside first and scan the 21 resilient stocks with low risk scores that score well on resilience and financial strength.
- Stay prepared and comb through the 74 high quality undiscovered gems before they attract wider attention.
This article by Simply Wall St is general in nature. We provide commentary based on historical data and analyst forecasts only using an unbiased methodology and our articles are not intended to be financial advice. It does not constitute a recommendation to buy or sell any stock, and does not take account of your objectives, or your financial situation. We aim to bring you long-term focused analysis driven by fundamental data. Note that our analysis may not factor in the latest price-sensitive company announcements or qualitative material. Simply Wall St has no position in any stocks mentioned.
Have feedback on this article? Concerned about the content? Get in touch with us directly. Alternatively, email editorial-team@simplywallst.com