
- PRICING
- LIVE QUOTES
- LEARN
- HELP


EN
Is Dynex Capital (DX) Undervalued After Its $120 Million Preferred Stock Offering?
Dynex Capital (DX) has just completed a US$120 million fixed income offering of 9.375% non convertible preferred stock, giving investors a new income-focused security with callable, cumulative features and a fixed coupon structure.
Against that backdrop, Dynex Capital’s common stock trades at US$11.34, with the share price down 6.9% over the past week and 19.5% year to date. However, the 1 year total shareholder return of 9.4% and 3 year total shareholder return of 47.1% point to stronger longer run momentum despite recent weakness around the preferred stock issuance.
Spot opportunities beyond Dynex Capital by scanning a curated shortlist of income and value ideas in our 8 dividend fortresses.Dynex Capital now trades well below the average analyst price target and far above a conservative intrinsic estimate. So where does fair value actually sit after the preferred stock move and the recent share pullback?
Price-to-Earnings of 6.6x: Is it justified?
Dynex Capital screens as inexpensive on a simple yardstick. At a P/E of 6.6x versus an $11.34 share price, the stock screens as cheap compared to peers even though the SWS DCF model points to an intrinsic value of $6.48, which would frame the current quote as expensive on a pure cash flow basis.
The P/E ratio compares what investors pay for each dollar of earnings, so for a mortgage REIT like Dynex Capital it effectively condenses expectations around future profit stability, interest-rate sensitivity, and balance sheet risk into a single figure. A lower multiple can signal skepticism about how durable those earnings are or concern about funding and dividend coverage, rather than a simple bargain.
Context matters here. Dynex Capital trades on a P/E of 6.6x against the US Mortgage REITs industry at 8.2x and a fair P/E estimate of 12.9x from the SWS fair ratio framework. That gap suggests the market is applying a heavy discount to the company relative to both its sector and what its earnings profile could support if sentiment or perceived risk moved closer to that fair ratio level.
Explore the SWS fair ratio for Dynex Capital.
Result: Price-to-Earnings of 6.6x (UNDERVALUED)
Still, the Dynex Capital story carries clear pressure points, including mortgage spread volatility and any hit to funding costs that compresses earnings and dividend flexibility.
Find out about the key risks to this Dynex Capital narrative.
Another View: Dynex Capital Through The DCF Lens
The low P/E paints Dynex Capital as inexpensive, yet the SWS DCF model lands on an intrinsic value of $6.48 against the current $11.34 share price. That frames the stock as expensive on projected cash flows. Which signal should carry more weight for you: earnings or cash generation?
Look into how the SWS DCF model arrives at its fair value.
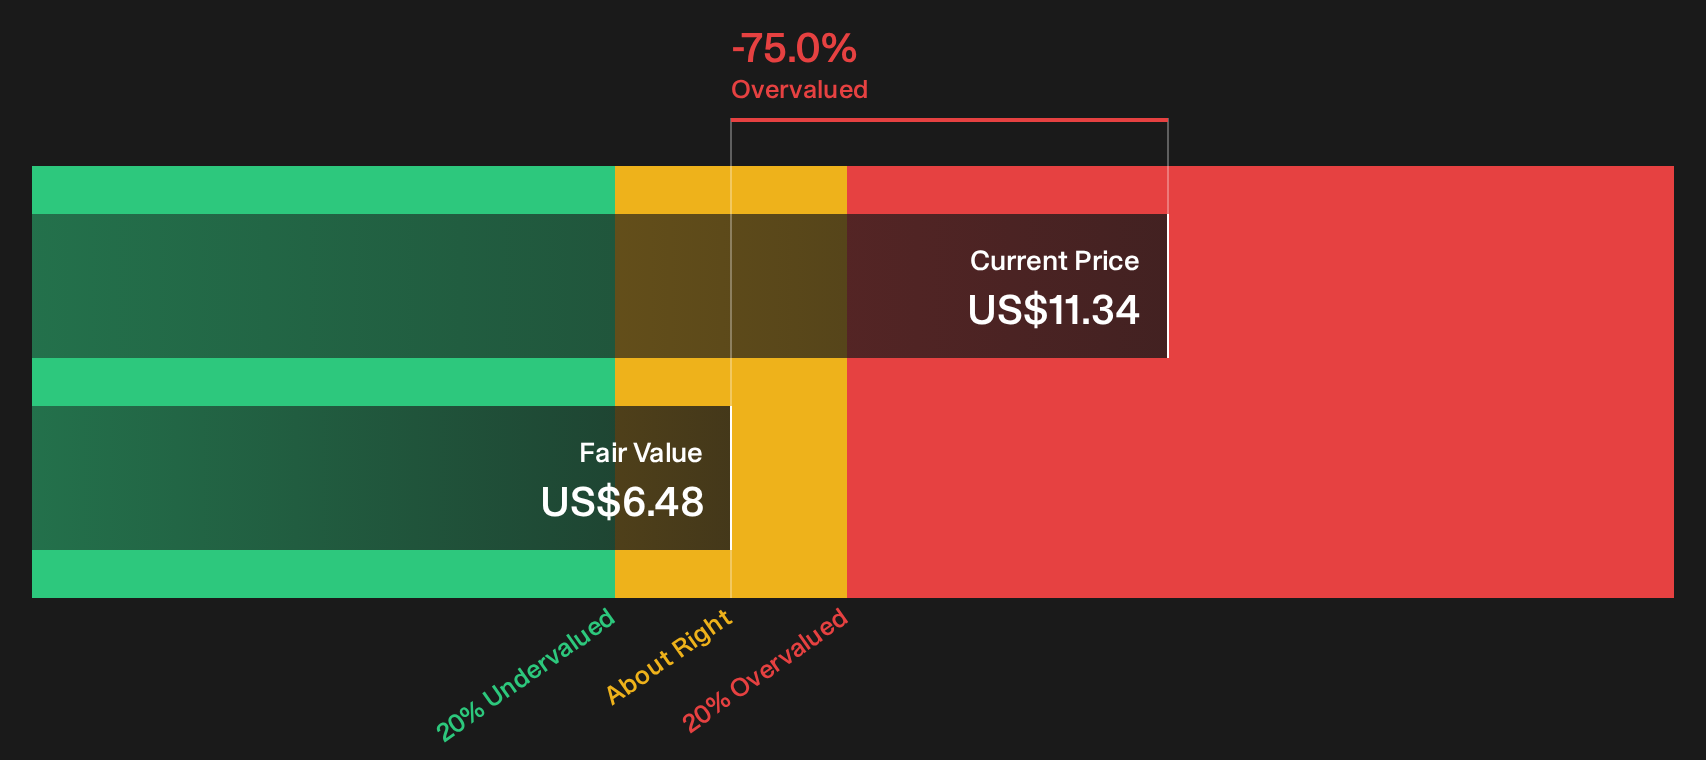
Simply Wall St performs a discounted cash flow (DCF) on every stock in the world every day (check out Dynex Capital for example). We show the entire calculation in full. You can track the result in your watchlist or portfolio and be alerted when this changes, or use our stock screener to discover 32 high quality undervalued stocks. If you save a screener we even alert you when new companies match - so you never miss a potential opportunity.
Next Steps
Mixed signals around Dynex Capital often create more questions than answers, which is exactly when fresh data matters most for your decision. Weigh both the upside and the risks by reviewing the full picture in our 5 key rewards and 3 important warning signs
Looking for more Dynex Capital style income ideas?
If Dynex Capital has your attention, do not stop your research here. The next step is widening your opportunity set so you are not relying on a single mortgage REIT for income or value exposure.
- Target resilient balance sheets by scanning a list of solid balance sheet and fundamentals (24 results) that can handle tougher conditions without forcing distressed capital raises.
- Hunt for pricing gaps using a 32 high quality undervalued stocks that filters for quality, cash generation, and sensible valuations instead of headline hype.
- Lock in potential income streams by reviewing a 8 dividend fortresses that focuses on stronger fundamentals behind those payout ratios, not just eye catching yields.
This article by Simply Wall St is general in nature. We provide commentary based on historical data and analyst forecasts only using an unbiased methodology and our articles are not intended to be financial advice. It does not constitute a recommendation to buy or sell any stock, and does not take account of your objectives, or your financial situation. We aim to bring you long-term focused analysis driven by fundamental data. Note that our analysis may not factor in the latest price-sensitive company announcements or qualitative material. Simply Wall St has no position in any stocks mentioned.
Have feedback on this article? Concerned about the content? Get in touch with us directly. Alternatively, email editorial-team@simplywallst.com