
- PRICING
- LIVE QUOTES
- LEARN
- HELP


EN
Deere (DE) Could Be 9% Below Fair Value On Q2 Earnings Beat
Dividend announcement sharpens focus on Deere’s cash returns
Deere (DE) recently declared a US$1.62 cash dividend with an ex-date of 30 September 2026, putting fresh attention on how the latest Q2 earnings beat might support ongoing shareholder payouts.
At a share price of US$690.46, Deere has delivered a 47.91% year to date share price return and a 50.67% total shareholder return over the past year, with the recent 12.59% 3 month share price gain suggesting momentum has been building ahead of this dividend announcement and Q2 beat.
Compare Deere’s cash return story with other industrials by scanning a curated set of list of solid balance sheet and fundamentals (24 results) that pair shareholder payouts with balance sheet strength.
After a 48% year to date climb and a share price near analyst targets, the debate around Deere now centers on valuation, how much of the good news already sits in the price, and what investors are still paying for.
Most Popular Narrative: 0% Overvalued
At a last close of $690.46 against a narrative fair value of $688.44, Deere is framed as roughly in line with intrinsic value, with the story hinging on how its technology and construction businesses support those cash returns over time.
Continued growth in Deere’s Construction & Forestry segment, with 2026 net sales guided to be up about 20% and order books largely full into fiscal 2027, supports the idea of a second earnings engine alongside agriculture and points to a broader revenue mix and more stable consolidated earnings as infrastructure, data center and energy related demand flows through future periods.
See why 116 investors see Deere as 0% overvalued.
Result: Fair Value of $688.44 (ABOUT RIGHT)
Still, the Deere narrative can crack if tariff costs stay elevated, or if large agriculture demand and South American markets remain weak for longer than expected.
Find out about the key risks to this Deere narrative.
Another View on Deere’s value
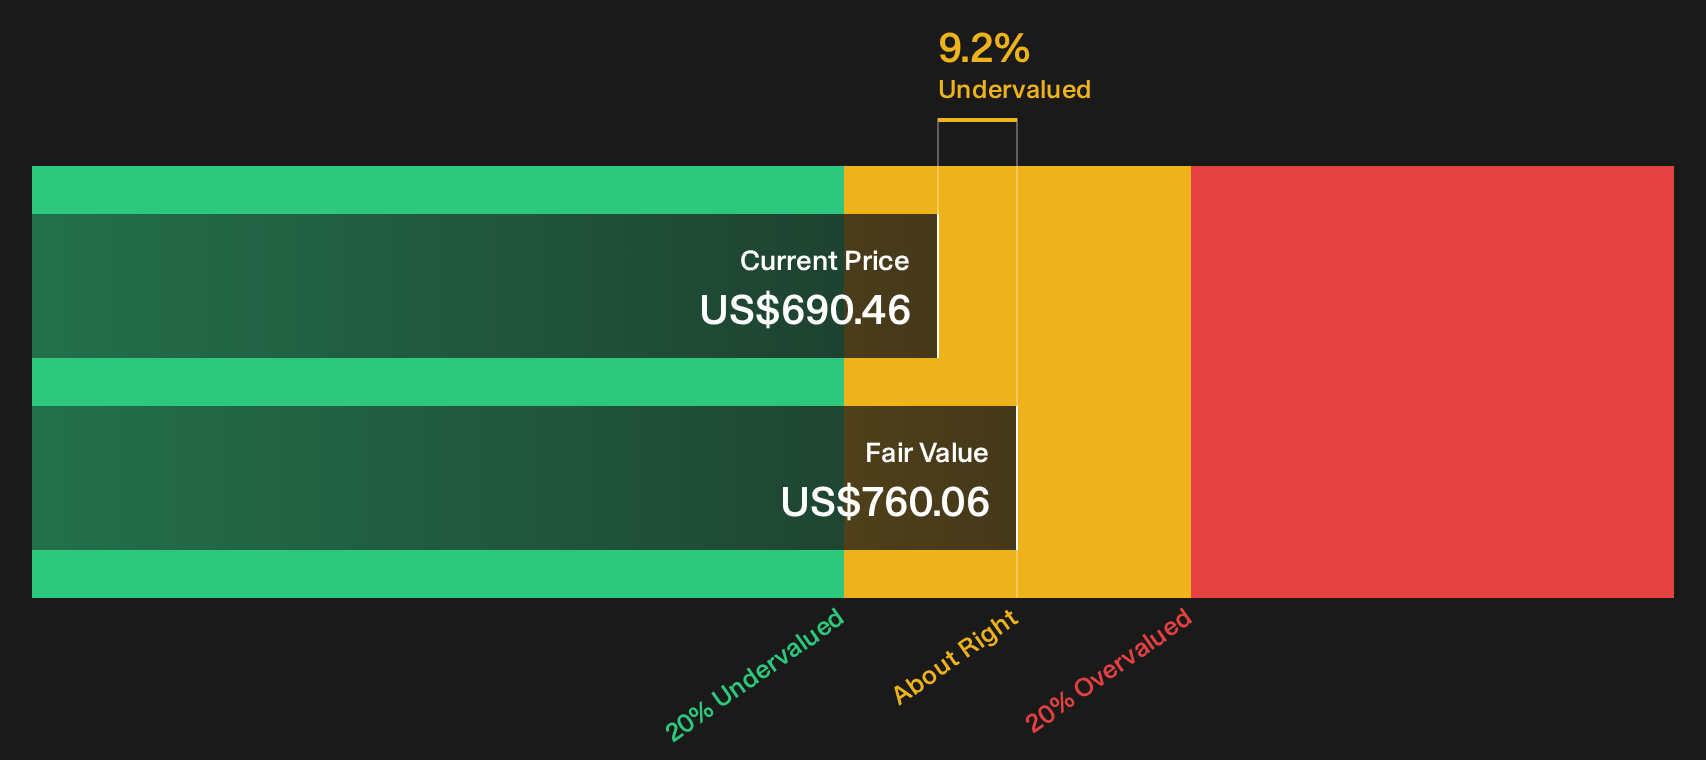
The earlier fair value narrative presented Deere as roughly in line with its $688.44 target. A second lens using the SWS DCF model points to a future cash flow value of $760.06. This puts the current $690.46 price about 9.2% below that estimate and raises the question of which perspective appears more compelling.
Look into how the SWS DCF model arrives at its fair value.
Simply Wall St performs a discounted cash flow (DCF) on every stock in the world every day (check out Deere for example). We show the entire calculation in full. You can track the result in your watchlist or portfolio and be alerted when this changes, or use our stock screener to discover 32 high quality undervalued stocks. If you save a screener we even alert you when new companies match - so you never miss a potential opportunity.
Next Steps
See a mixed picture in Deere’s story so far, with both concern and optimism in the data. Then move quickly to weigh those signals yourself using 2 key rewards and 1 important warning sign.
Looking for more ideas beyond Deere?
If Deere has sharpened your focus on quality and cash returns, you may want to broaden your opportunity set with a few targeted stock ideas that share similar strengths.
- Target resilient compounding potential by scanning companies screened as 30 resilient stocks with low risk scores that aim to balance upside with controlled downside.
- Hunt for mispriced quality by reviewing a curated group of 32 high quality undervalued stocks that pair robust fundamentals with attractive entry points.
- Spot tomorrow’s potential leaders early by checking a focused collection of 16 high quality undiscovered gems with solid financial underpinnings before the crowd arrives.
This article by Simply Wall St is general in nature. We provide commentary based on historical data and analyst forecasts only using an unbiased methodology and our articles are not intended to be financial advice. It does not constitute a recommendation to buy or sell any stock, and does not take account of your objectives, or your financial situation. We aim to bring you long-term focused analysis driven by fundamental data. Note that our analysis may not factor in the latest price-sensitive company announcements or qualitative material. Simply Wall St has no position in any stocks mentioned.
Have feedback on this article? Concerned about the content? Get in touch with us directly. Alternatively, email editorial-team@simplywallst.com