
- PRICING
- LIVE QUOTES
- LEARN
- HELP


EN
Nihon Kohden (TSE:6849) Could Be 17% Undervalued On FTSE All World Index Removal
Index removal puts fresh attention on Nihon Kohden
Nihon Kohden (TSE:6849) has been removed from the FTSE All-World Index, drawing fresh attention to how index reshuffles can affect liquidity, ownership patterns, and pricing for long term investors.
Recent trading has been choppy for Nihon Kohden. The share price is ¥1,625 after a 9.28% 30 day share price return and 13.92% over 90 days. However, the year to date share price return is down 4.10% and the 1 year total shareholder return is down 2.57%, hinting that near term momentum is improving while longer term holders have not yet fully recovered.
Scan how other healthcare stocks with sturdy balance sheets are trading around index reshuffles by reviewing our curated list of solid balance sheet and fundamentals (22 results) alongside Nihon Kohden today.
The recent swing in Nihon Kohden after its index exit leaves a simple tension. Are investors responding to fundamentals, or to shifting sentiment around a ¥1,625 share price ahead of valuation work?
Price-to-earnings of 19.1x for Nihon Kohden: Is it justified?
Nihon Kohden trades on a P/E of 19.1x, which leaves the share price at ¥1,625 looking more expensive than much of the JP Medical Equipment sector while still screened as reasonable against some fair value checks.
The P/E ratio compares the current share price with the last 12 months of earnings per share. For a medical equipment group like Nihon Kohden, that benchmark reflects how much investors are willing to pay for existing profitability rather than just future revenue potential.
The stock is described as expensive versus the JP Medical Equipment industry average P/E of 17.1x, so the market is paying a higher multiple than many domestic peers. At the same time, it is flagged as good value against a peer average P/E of 40.1x and also sits just below an estimated fair P/E of 19.9x, a level the market could move towards if sentiment and fundamentals stay aligned with that framework.
Explore the SWS fair ratio for Nihon Kohden.
Result: Price-to-earnings of 19.1x (ABOUT RIGHT)
Still, the story around Nihon Kohden can shift quickly if index related selling deepens or if profit growth fails to keep pace with its 19.1x P/E.
Find out about the key risks to this Nihon Kohden narrative.
Another view on Nihon Kohden’s value
The P/E discussion presents Nihon Kohden as roughly fairly priced, yet the SWS DCF model points in a different direction. At a share price of ¥1,625, the stock screens as trading 17.3% below an estimated future cash flow value of ¥1,965.48. Is that a genuine margin of safety or just model noise?
Look into how the SWS DCF model arrives at its fair value.
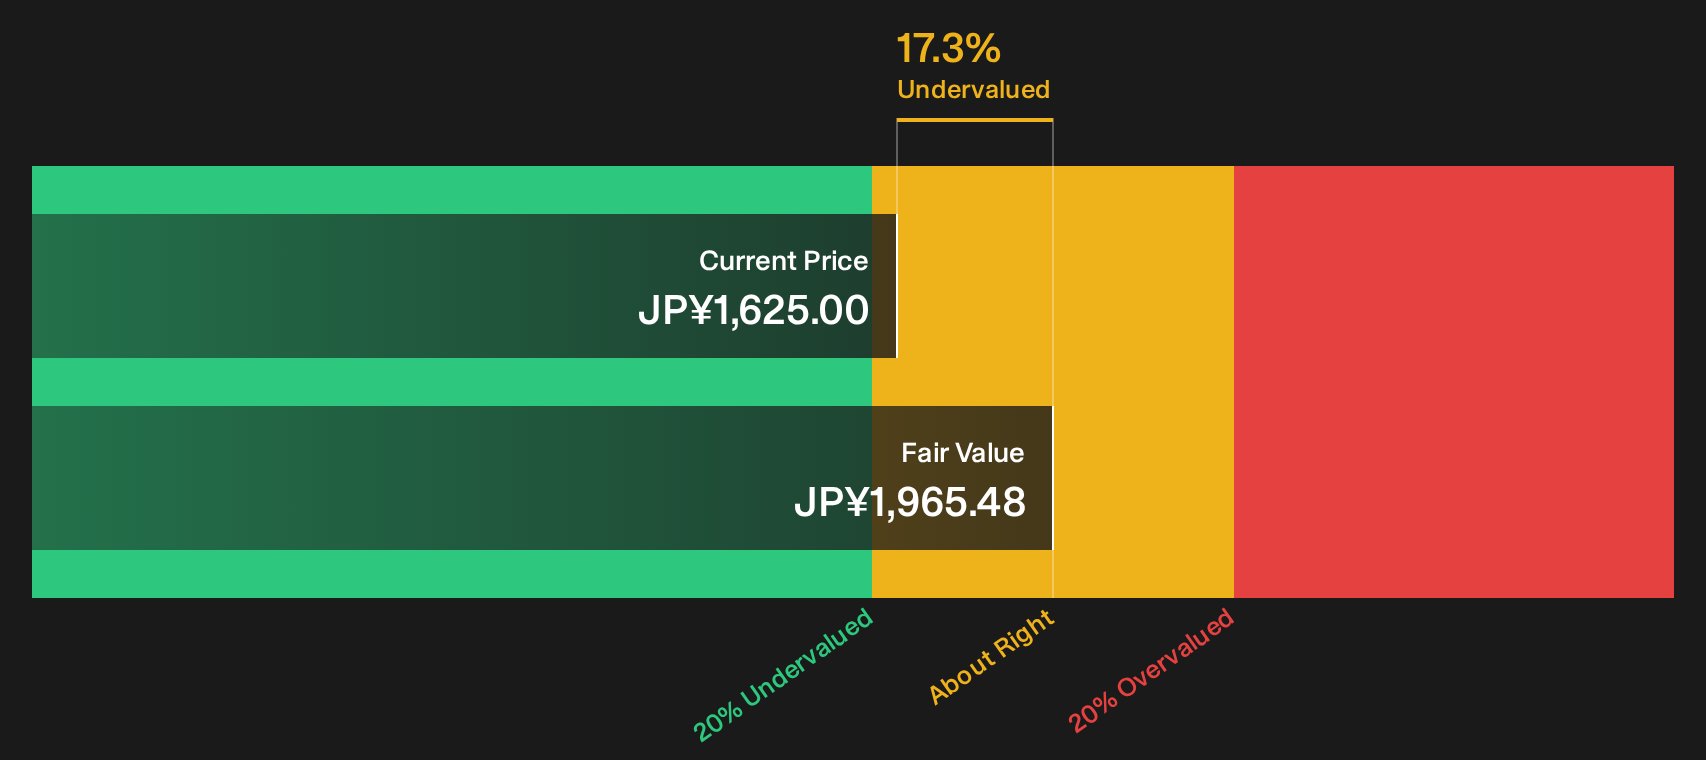
Simply Wall St performs a discounted cash flow (DCF) on every stock in the world every day (check out Nihon Kohden for example). We show the entire calculation in full. You can track the result in your watchlist or portfolio and be alerted when this changes, or use our stock screener to discover 18 high quality undervalued stocks. If you save a screener we even alert you when new companies match - so you never miss a potential opportunity.
Next Steps
Feeling that the Nihon Kohden story could break either way from here. Move quickly, review the full picture, and weigh the 3 key rewards.
Looking for more Nihon Kohden sized investment ideas?
You have seen how Nihon Kohden screens on valuation and fundamentals. Now widen your opportunity set and pressure test your watchlist using focused screeners.
- Target steadier potential by reviewing companies that clear high financial quality hurdles through our 21 resilient stocks with low risk scores.
- Hunt for possible mispriced opportunities by scanning the 18 high quality undervalued stocks that match strong fundamentals with compressed valuations.
- Zero in on resilient income ideas by checking the 14 dividend fortresses that pair higher yields with more robust balance sheets.
This article by Simply Wall St is general in nature. We provide commentary based on historical data and analyst forecasts only using an unbiased methodology and our articles are not intended to be financial advice. It does not constitute a recommendation to buy or sell any stock, and does not take account of your objectives, or your financial situation. We aim to bring you long-term focused analysis driven by fundamental data. Note that our analysis may not factor in the latest price-sensitive company announcements or qualitative material. Simply Wall St has no position in any stocks mentioned.
Have feedback on this article? Concerned about the content? Get in touch with us directly. Alternatively, email editorial-team@simplywallst.com