
- PRICING
- LIVE QUOTES
- LEARN
- HELP


EN
Is China Merchants Port Holdings (SEHK:144) Undervalued On Its Latest Dividend Update?
China Merchants Port Holdings (SEHK:144) has set an ex-dividend date of 24 September 2026 for a total payout of $0.03 per share, putting its dividend policy back in focus for income-oriented investors.
At a share price of HK$16.89, China Merchants Port Holdings has seen firm momentum build, with a 30 day share price return of 6.03% and a 90 day share price return of 32.89%. These gains feed into a 1 year total shareholder return of 21.75% and a 3 year total shareholder return of 104.92%.
Compare China Merchants Port Holdings' dividend profile with hand-picked income ideas across our 162 dividend fortresses to see how its payout stacks up against other potential cash generators.
China Merchants Port Holdings now screens as a solid dividend payer with recent share price strength on its side. The key question is whether that quality is already fully reflected in today’s HK$16.89 valuation.
Preferred Price-to-Earnings of 10.6x: Is it justified?
Valuation for China Merchants Port Holdings hinges on how much investors are willing to pay for each dollar of profit, and the current P/E multiple of 10.6x sets that reference point against both peers and an internal fair-value benchmark.
The P/E ratio compares the HK$16.89 share price with the company’s earnings per share to show how many times profits the market is currently paying. For an infrastructure focused group with ports, logistics and property activities across Mainland China, Hong Kong, Taiwan, Brazil and other regions, earnings based metrics are a common way for investors to think about pricing.
On one side, the stock is described as expensive versus its immediate peer set, with a P/E of 10.6x compared to a peer average of 8.6x. That suggests buyers today are paying a richer multiple than for similar companies, even though earnings have declined by 3.6% per year over the past 5 years and net margins have moved from 56.4% to 47.2%. On the other side, the same 10.6x multiple is flagged as good value versus both the Asian Infrastructure industry at 12.9x and an estimated fair P/E ratio of 11.9x. This implies the valuation could plausibly shift closer to that higher level if sentiment and fundamentals line up.
Against the Asian Infrastructure average, China Merchants Port Holdings trades at a meaningfully lower earnings multiple. This points to a discount relative to the broader regional group even as it trades richer than a narrower peer set. The fair P/E estimate of 11.9x is also clearly higher than the current 10.6x, which indicates that the market price could move toward that level if the business delivers on expectations around earnings quality, cash generation and growth.
Explore the SWS fair ratio for China Merchants Port Holdings.
Result: Price-to-earnings of 10.6x (ABOUT RIGHT)
Still, the recent 3.6% annual earnings decline and the shift in net margins from 56.4% to 47.2% leave little room for operational missteps.
Find out about the key risks to this China Merchants Port Holdings narrative.
Another View on China Merchants Port Holdings: DCF Signals a Steep Gap
The P/E workup presents China Merchants Port Holdings as roughly fairly priced, but the SWS DCF model points in a very different direction. At HK$16.89 against an estimated future cash flow value of HK$78.57, the stock appears heavily undervalued on this cash-based lens. Which signal would you place more weight on when real money is on the line?
Look into how the SWS DCF model arrives at its fair value.
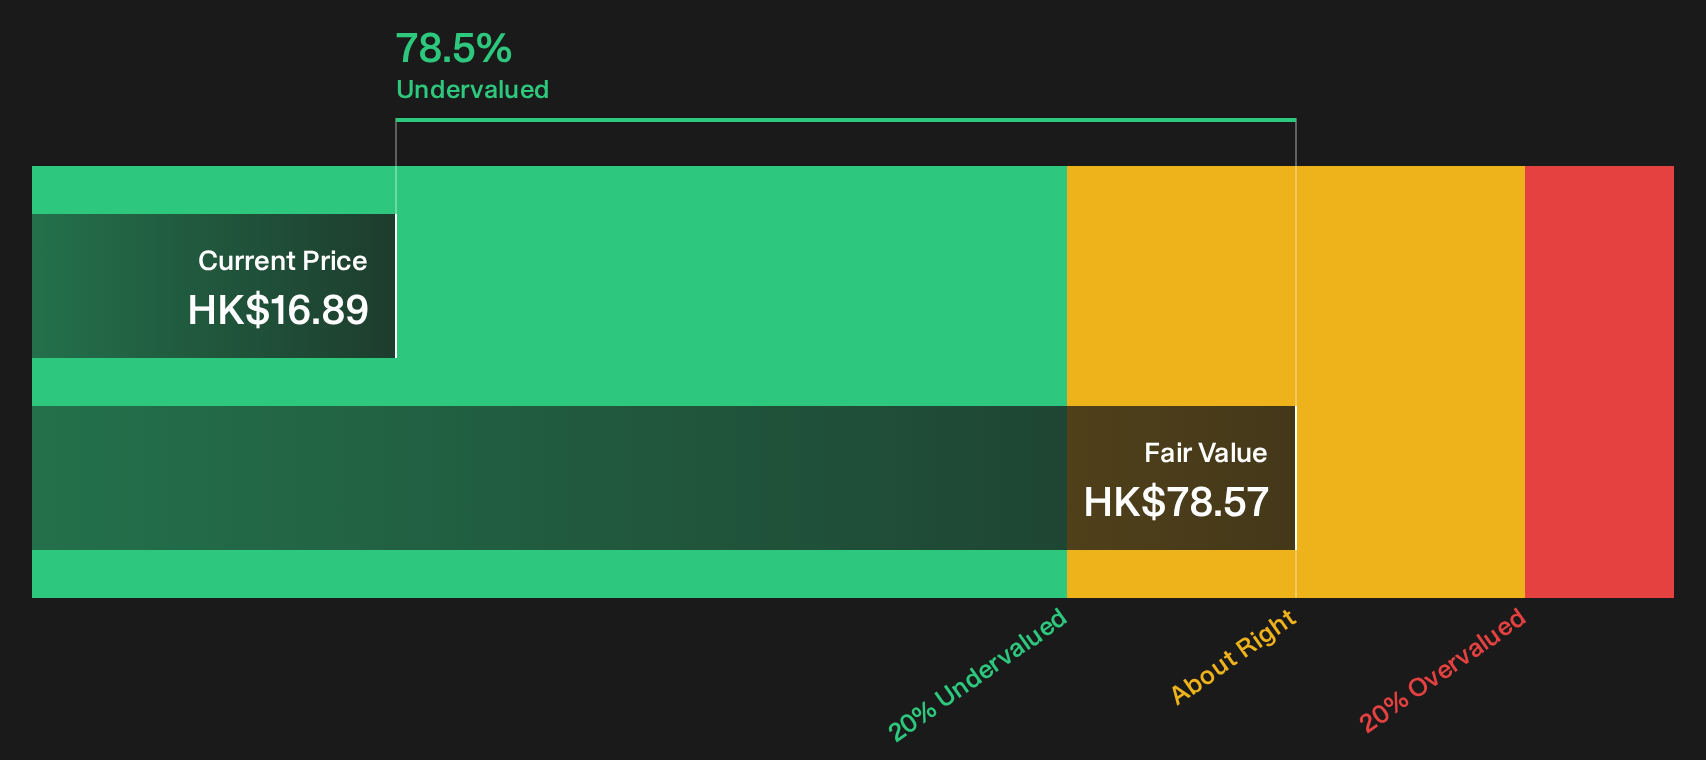
Simply Wall St performs a discounted cash flow (DCF) on every stock in the world every day (check out China Merchants Port Holdings for example). We show the entire calculation in full. You can track the result in your watchlist or portfolio and be alerted when this changes, or use our stock screener to discover 182 high quality undervalued stocks. If you save a screener we even alert you when new companies match - so you never miss a potential opportunity.
Next Steps
Mixed signals around China Merchants Port Holdings can be confusing, so it helps to check the data directly and decide how the risk reward trade off looks in your own portfolio. To see how the positives and pressure points line up in one place, review the 2 key rewards and 1 important warning sign.
Looking for more investment ideas beyond China Merchants Port Holdings?
Do not stop your research at one stock. Broaden your watchlist with fresh ideas that match your goals before the next round of opportunities starts to move.
- Target potential upside by scanning 182 high quality undervalued stocks that combine attractive pricing with solid underlying fundamentals.
- Prioritise resilience with a list of solid balance sheet and fundamentals (202 results) that can better handle shocks and funding pressure.
- Spot early stage potential through a focused set of 129 elite penny stocks with strong financials that already show stronger financial quality than most in their bracket.
This article by Simply Wall St is general in nature. We provide commentary based on historical data and analyst forecasts only using an unbiased methodology and our articles are not intended to be financial advice. It does not constitute a recommendation to buy or sell any stock, and does not take account of your objectives, or your financial situation. We aim to bring you long-term focused analysis driven by fundamental data. Note that our analysis may not factor in the latest price-sensitive company announcements or qualitative material. Simply Wall St has no position in any stocks mentioned.
Have feedback on this article? Concerned about the content? Get in touch with us directly. Alternatively, email editorial-team@simplywallst.com