
- PRICING
- LIVE QUOTES
- LEARN
- HELP


EN
SMS (TSE:2175), Why Is It Back In The Spotlight?
SMS (TSE:2175) drew fresh attention after recent share price moves, with the stock closing at ¥2,630. Investors are weighing that level against its value score of 3 and ongoing healthcare focused operations.
Recent trading has cooled slightly, with the share price return down 0.8% over one day and 1.6% over the past week. However, SMS still shows strong momentum, with a 30-day share price return of 9.5%, a year-to-date share price return of 94.8%, and a 1-year total shareholder return of 70.3%. This contrasts with a weaker 5-year total shareholder return, which shows a decline of 30.8%.
Scan how SMS compares with a hand picked group of healthcare focused operators using the list of solid balance sheet and fundamentals (22 results) as a starting universe for your next idea.
After SMS surged ahead of its value score and recently slipped back, the gap between the ¥2,630 price, analyst targets, and intrinsic estimates now matters more than the headline rally itself. The key question is where fair value really sits.
Preferred Price-to-Sales of 3.3x: Is it justified?
On the numbers alone, SMS trades on a P/S of 3.3x, which looks rich against peers but still screens as good value compared to an estimated fair P/S of 4.4x and the current share price of ¥2,630.
The price to sales ratio compares the company’s market value to its ¥66,275 revenue and is often used when a business is loss making, as SMS currently is with a reported loss of ¥14,529. For a healthcare focused service provider that is still in an investment phase, investors often lean on P/S to judge what they are paying for each unit of revenue while waiting for profits to stabilise.
Here, the picture is mixed. On one side, SMS is flagged as good value against an estimated fair P/S of 4.4x, which indicates a level the market might consider relative to that benchmark. On the other side, the same P/S of 3.3x is described as expensive versus both the peer average of 2.5x and the wider JP Professional Services industry on 0.9x. This signals that the market is already pricing in relatively stronger revenue characteristics or a more resilient business model than the typical operator in this space.
Explore the SWS fair ratio for SMS.
Result: Price-to-sales of 3.3x (OVERVALUED).
Still, the recent loss of ¥14,529 and the current share price, which is trading at a 28.4% premium to the ¥1,882.5 analyst target, leave SMS exposed to sentiment turning quickly.
Find out about the key risks to this SMS narrative.
Another View on SMS: SWS DCF Fair Value
The SWS DCF model points in a different direction for SMS. On that framework, the intrinsic value lands at ¥3,335.79 per share, compared with the current ¥2,630 price, which suggests the stock screens as undervalued on future cash flow assumptions.
This sort of gap can cut both ways. It offers potential upside if those cash flows arrive as projected, but it also leaves you exposed if the business falls short of the model’s expectations. That raises a simple question: Which signal do you treat as more important, the richer P/S against peers or the cheaper DCF outcome?
Look into how the SWS DCF model arrives at its fair value.
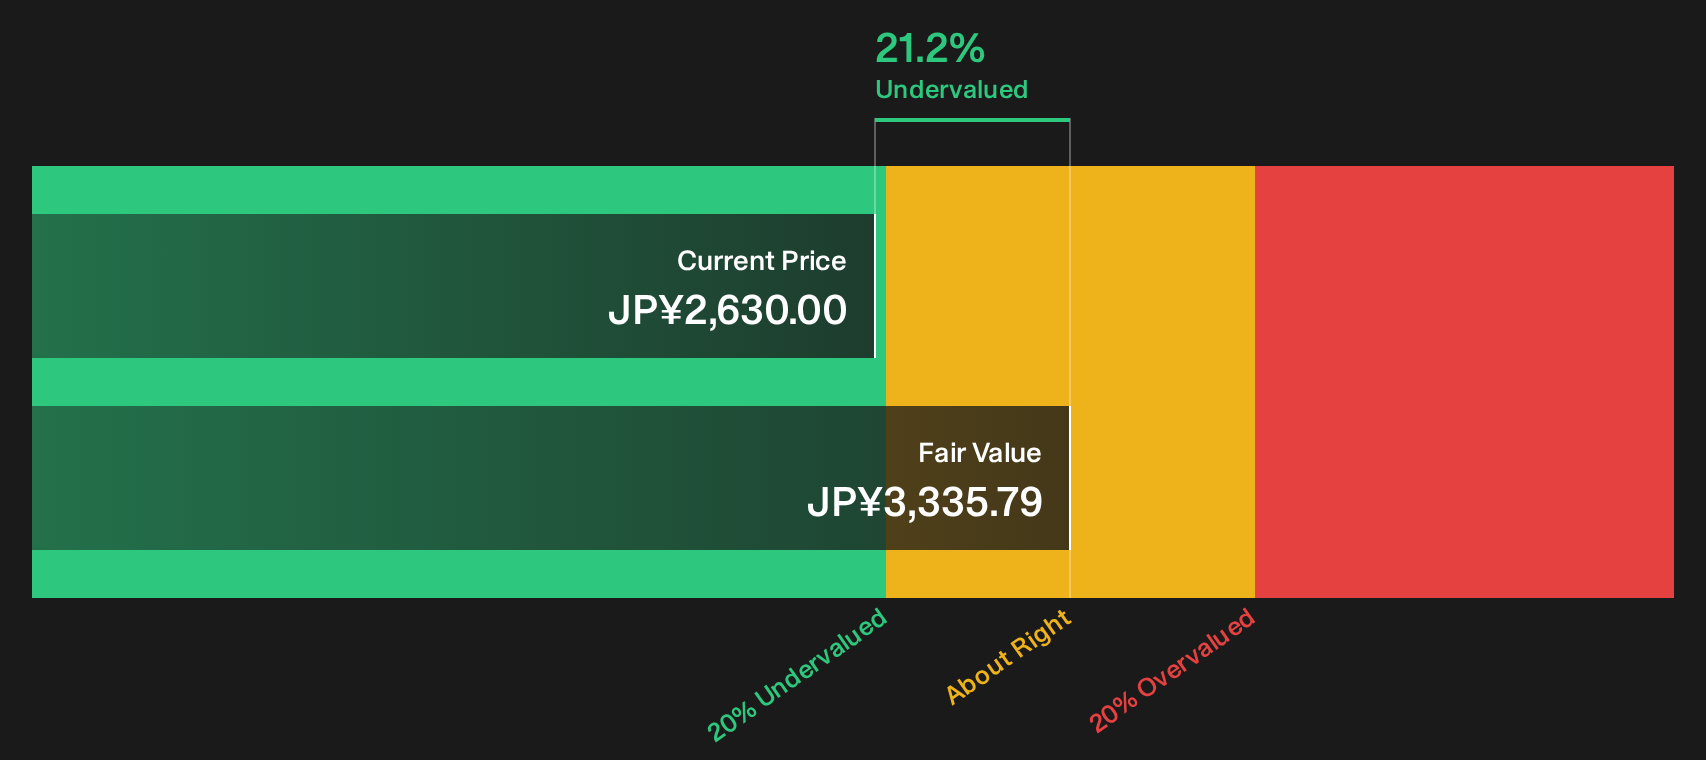
Simply Wall St performs a discounted cash flow (DCF) on every stock in the world every day (check out SMS for example). We show the entire calculation in full. You can track the result in your watchlist or portfolio and be alerted when this changes, or use our stock screener to discover 18 high quality undervalued stocks. If you save a screener we even alert you when new companies match - so you never miss a potential opportunity.
Next Steps
Mixed signals around SMS are clear, so treat this as a prompt to check the underlying data yourself and pressure test every metric. To see what the optimism is built on, review the 2 key rewards.
Looking for more SMS investment ideas?
If SMS has caught your attention, do not stop your research here. Use focused screens to uncover other opportunities that could fit your style just as well.
- Target value driven opportunities by scanning a curated pool of stocks that currently screen as attractively priced on fundamentals through the 18 high quality undervalued stocks.
- Prioritise resilience by reviewing companies that show robust balance sheets and solid underlying metrics using the list of solid balance sheet and fundamentals (22 results).
- Hunt for under the radar opportunities by searching a focused universe of smaller businesses with strong fundamentals via the 74 high quality undiscovered gems.
This article by Simply Wall St is general in nature. We provide commentary based on historical data and analyst forecasts only using an unbiased methodology and our articles are not intended to be financial advice. It does not constitute a recommendation to buy or sell any stock, and does not take account of your objectives, or your financial situation. We aim to bring you long-term focused analysis driven by fundamental data. Note that our analysis may not factor in the latest price-sensitive company announcements or qualitative material. Simply Wall St has no position in any stocks mentioned.
Have feedback on this article? Concerned about the content? Get in touch with us directly. Alternatively, email editorial-team@simplywallst.com