
- PRICING
- LIVE QUOTES
- LEARN
- HELP


EN
Is Park National (PRK) Undervalued Or Overvalued On Mixed Valuation Signals?
Park National (PRK) has drawn fresh attention after a recent price move, with the shares closing at $181.68. The question for investors is whether current trading reflects underlying fundamentals.
Recent trading puts that move in context. Park National’s 1-day share price return of 0.79% comes after a 30-day share price decline of 8.95%. Meanwhile, the year-to-date share price return of 17.73% and a 3-year total shareholder return of 110.80% point to momentum that has built over a longer horizon, even as near term sentiment has cooled.
Compare Park National’s recent swing with a curated group of regional financials by scanning the 30 resilient stocks with low risk scores, which combines more resilient balance sheets with measured share price moves.
After a sharp 30-day pullback but solid multiyear gains, Park National now sits at $181.68, alongside a lower value score and a flagged intrinsic discount. Does that mix still leave enough upside to justify the risk?
Price-to-Earnings of 17.3x: Is it justified?
On traditional metrics, Park National screens as expensive, with a P/E of 17.3x against both its own fair ratio estimate and banking peers, despite the recent pullback to $181.68.
The P/E ratio compares the current share price with earnings per share. For a regional bank like Park National, it reflects what investors are willing to pay today for each dollar of profit, given its earnings profile, dividend track record and perceived risk.
Park National carries a P/E of 17.3x while the estimated fair P/E for the stock is 13.3x. That gap suggests the market is paying a materially richer price than the level the fair ratio models point to. Since earnings are forecast to grow 12.4% per year and revenue is projected to rise 7.6% per year, investors may be pricing in a relatively steady but not very fast growth path.
Against the broader US Banks industry average P/E of 11.6x, Park National trades on a clearly higher multiple. Compared to a 14.6x peer average, the premium still holds. Those comparisons indicate investors are assigning a premium valuation that the fair ratio implies could compress over time if expectations reset.
Explore the SWS fair ratio for Park National.
Result: Price-to-Earnings of 17.3x (OVERVALUED)
Still, Park National’s premium P/E and lower value score could reset quickly if credit quality weakens or loan growth slows relative to expectations.
Find out about the key risks to this Park National narrative.
Another view on Park National's value
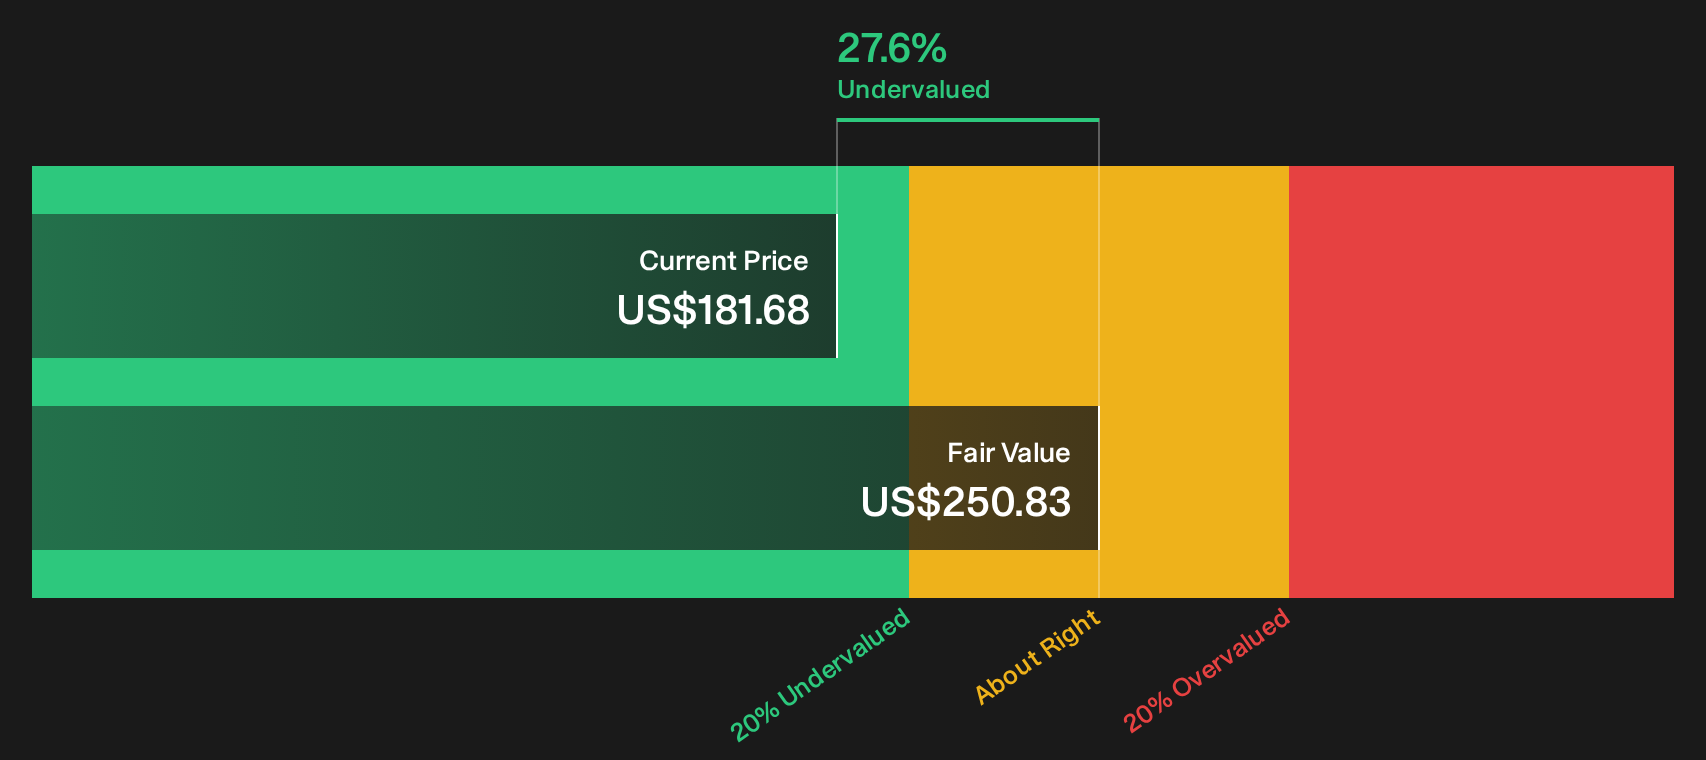
The first check makes Park National look expensive on a 17.3x P/E. A second lens tells a different story. Our DCF model estimates future cash flows at $250.83 per share, compared with the current $181.68 price, which implies the stock trades at a 27.6% discount.
That kind of gap signals either a cushion if expectations cool or a sign that the model is too generous about future cash generation. The real question for investors is which side of that tradeoff feels more realistic.
Look into how the SWS DCF model arrives at its fair value.
Simply Wall St performs a discounted cash flow (DCF) on every stock in the world every day (check out Park National for example). We show the entire calculation in full. You can track the result in your watchlist or portfolio and be alerted when this changes, or use our stock screener to discover 31 high quality undervalued stocks. If you save a screener we even alert you when new companies match - so you never miss a potential opportunity.
Next Steps
If the tone so far feels mixed, that is intentional, because Park National carries both question marks and some clearly identified positives. Act quickly, test the numbers against your own expectations, and then pressure test those optimistic angles through the 4 key rewards
Looking for more Park National style ideas?
If Park National has your attention, do not stop here. Use the Simply Wall Street Screener to surface focused sets of shares that match your priorities.
- Target resilient balance sheets and steadier price moves by reviewing the list of solid balance sheet and fundamentals (24 results) to filter for financial strength and fundamentals.
- Hunt for mispriced opportunities by scanning the 31 high quality undervalued stocks to highlight shares with strong fundamentals trading below fair value estimates.
- Build a cash flow focused portfolio by studying the 8 dividend fortresses to find higher yielding companies with an emphasis on sustainability.
This article by Simply Wall St is general in nature. We provide commentary based on historical data and analyst forecasts only using an unbiased methodology and our articles are not intended to be financial advice. It does not constitute a recommendation to buy or sell any stock, and does not take account of your objectives, or your financial situation. We aim to bring you long-term focused analysis driven by fundamental data. Note that our analysis may not factor in the latest price-sensitive company announcements or qualitative material. Simply Wall St has no position in any stocks mentioned.
Have feedback on this article? Concerned about the content? Get in touch with us directly. Alternatively, email editorial-team@simplywallst.com