
- PRICING
- LIVE QUOTES
- LEARN
- HELP


EN
CRH (CRH) Has Investors Looking Closer, So What Is Behind The Attention?
CRH (NYSE:CRH) has drawn attention after a recent stretch of weaker returns, with the share price down over the past month and over the past 3 months. This has prompted fresh questions about valuation and business momentum.
Over a longer stretch, CRH has delivered a strong 3-year total shareholder return of 63.13% and 5-year total shareholder return of 96.14%. However, the 30-day share price return of down 12.38% and year-to-date share price return of down 32.74% point to fading momentum as investors reassess growth prospects and risk around the current US$85.04 level.
Scan how CRH compares to other construction and materials players under pressure by reviewing the hand picked list of solid balance sheet and fundamentals (24 results).
So is CRH’s slide toward US$85 more about cracks in the business or about sentiment cooling after a strong multi year run, and what does the current valuation actually suggest you are paying for?
Preferred P/E of 14.8x for CRH: Is it justified?
On recent figures, CRH trades on a P/E of 14.8x, which leaves the share price at $85.04 looking cheaper than both its peer group and an internally estimated fair P/E level.
P/E compares the current share price with earnings per share and gives a quick sense of how much investors are paying for each dollar of profit. For a large construction materials business like CRH, this is a common yardstick because profit trends often track the economic cycle and capital intensity.
Here, the picture is mixed. CRH screens as expensive against the global Basic Materials sector average P/E of 14.2x, which points to the market assigning a small premium to its earnings. At the same time, it is described as good value versus a peer average multiple of 25.3x and an estimated fair P/E of 23.3x. This is a level the valuation work suggests the market could move towards if sentiment improved or earnings held up.
Explore the SWS fair ratio for CRH.
Result: Price-to-earnings of 14.8x (UNDERVALUED)
Still, CRH faces real pressure if construction demand weakens further or if higher borrowing costs constrain funding for large infrastructure and housing projects.
Find out about the key risks to this CRH narrative.
Another view on CRH valuation
The P/E story suggests CRH might be cheap, but a different lens tells you more. Our DCF model points to a fair value of $98.46 per share, which is about 13.6% above the current $85.04 price and indicates the stock may be undervalued based on future cash flow assumptions.
This sort of gap can close in either direction. It can move through a higher share price if expectations hold up or through weaker delivery if forecasts prove too optimistic. The key consideration is which side of that equation appears more realistic based on your view of CRH.
Look into how the SWS DCF model arrives at its fair value.
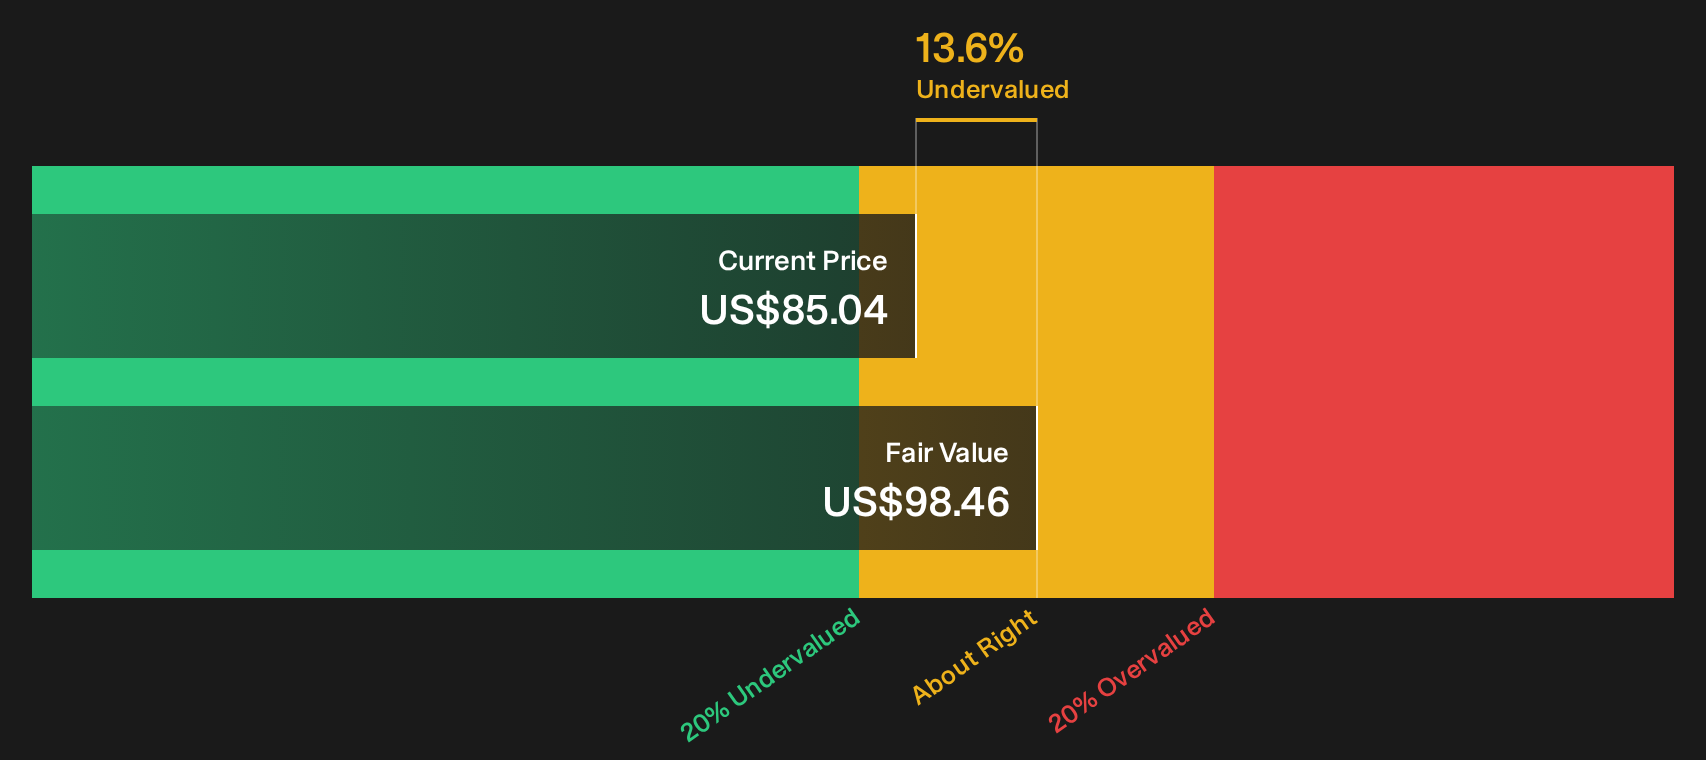
Simply Wall St performs a discounted cash flow (DCF) on every stock in the world every day (check out CRH for example). We show the entire calculation in full. You can track the result in your watchlist or portfolio and be alerted when this changes, or use our stock screener to discover 31 high quality undervalued stocks. If you save a screener we even alert you when new companies match - so you never miss a potential opportunity.
Next Steps
Mixed feelings on CRH after this pullback. If you want to move quickly and test the conviction behind the current pricing, weigh both sides of the story with the 5 key rewards and 1 important warning sign
Looking for more CRH sized investment ideas?
If CRH has sharpened your focus on value and risk, it makes sense to line up a few other candidates before the next opportunity window closes.
- Target resilience by reviewing a curated 30 resilient stocks with low risk scores that filters for companies with more defensive profiles when markets turn choppy.
- Hunt for mispriced quality through the 16 high quality undiscovered gems and spot businesses that the broader market may not be paying attention to yet.
- Put income first with the 8 dividend fortresses and focus on companies offering higher yields with an emphasis on payout strength.
This article by Simply Wall St is general in nature. We provide commentary based on historical data and analyst forecasts only using an unbiased methodology and our articles are not intended to be financial advice. It does not constitute a recommendation to buy or sell any stock, and does not take account of your objectives, or your financial situation. We aim to bring you long-term focused analysis driven by fundamental data. Note that our analysis may not factor in the latest price-sensitive company announcements or qualitative material. Simply Wall St has no position in any stocks mentioned.
Have feedback on this article? Concerned about the content? Get in touch with us directly. Alternatively, email editorial-team@simplywallst.com