
- PRICING
- LIVE QUOTES
- LEARN
- HELP


EN
Swatch Group (SWX:UHR) Rose In The Latest Session, Is It Still Undervalued?
Swatch Group (SWX:UHR) moved higher in the latest session, with the share price closing at CHF 183.25. Recent trading has included gains over the past week but a decline over the past 3 months.
Recent action around Swatch Group points to fading short term momentum, with a 1 month share price return down 3.3% and a 3 month share price return down 9.6%. This comes even though the year to date share price return is up 6.5% and the 1 year total shareholder return is 25.1%.
Scan how Swatch Group compares with other quality consumer stocks by reviewing our hand picked list of 620 high quality undiscovered gems in the same research session.
Swatch Group now combines a solid 1 year shareholder return with softer recent trading and a flagged intrinsic discount. Does that mix still tilt the risk reward in favour of new buyers at today’s price, or not?
Preferred Price-to-Sales of 1.5x: Is it justified?
Swatch Group screens as good value on some metrics and expensive on others, which puts the current CHF 183.25 share price in a grey zone that readers need to unpack carefully. The P/S ratio of 1.5x is flagged as attractive versus the fair level and peer group, even though it is higher than the wider European luxury cohort.
The price to sales multiple looks at how much investors are paying for each franc of Swatch Group revenue. For a business generating CHF 6,342.0m of sales across brands from Omega and Longines to Swatch and Tissot, this ratio gives a quick read on how the market is valuing that top line relative to similar groups.
Against an estimated fair P/S of 2.2x, the current 1.5x looks meaningfully lower. This suggests the market could be assigning a discount to the level indicated by the fair ratio. Compared with direct peers on a 1.9x average, Swatch Group again trades on a cheaper multiple. However, against the broader European luxury industry at 0.8x, the same 1.5x looks clearly richer, indicating investors are pricing it above the sector norm while still below what the fair ratio implies.
Explore the SWS fair ratio for Swatch Group.
Result: Price-to-sales of 1.5x (ABOUT RIGHT)
Still, Swatch Group faces clear risks if luxury demand softens or if the Electronic Systems division underperforms. This could challenge the implied valuation support.
Find out about the key risks to this Swatch Group narrative.
Another View on Swatch Group’s CHF 183.25 Price
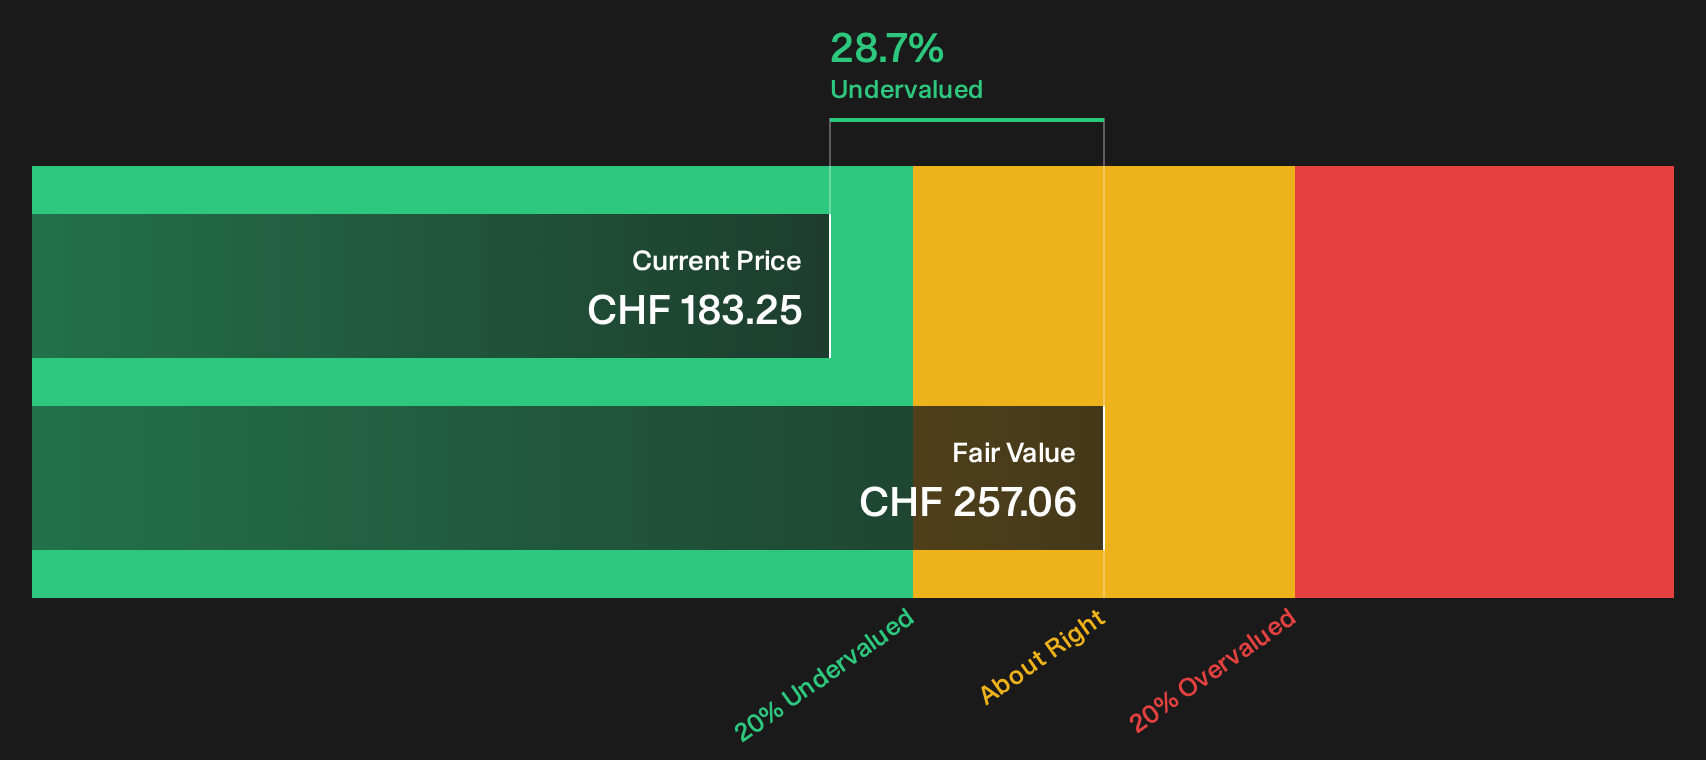
The SWS DCF model offers a different lens. On this approach, Swatch Group at CHF 183.25 trades below an estimated future cash flow value of CHF 257.06, which indicates that the shares are undervalued rather than simply sitting in a grey zone on sales multiples.
That gap reflects a market price that sits well under the modelled cash flow stream. This can appear as an opportunity to some investors, but it also raises the question of what risks or doubts are keeping the discount in place.
Look into how the SWS DCF model arrives at its fair value.
Simply Wall St performs a discounted cash flow (DCF) on every stock in the world every day (check out Swatch Group for example). We show the entire calculation in full. You can track the result in your watchlist or portfolio and be alerted when this changes, or use our stock screener to discover 180 high quality undervalued stocks. If you save a screener we even alert you when new companies match - so you never miss a potential opportunity.
Next Steps
Does the mix of discounted cash flow value, fair ratio signals and recent share price swings around Swatch Group leave you cautious or curious? Act while the data is fresh and form your own view by weighing both the upside potential and the risk flags captured in our 2 key rewards and 2 important warning signs.
Looking for more Swatch Group investment ideas?
If Swatch Group has you rethinking your watchlist, use this momentum to scan wider. Fresh ideas often appear where the market is not looking yet.
- Spot potential value early by running through our 128 elite penny stocks with strong financials which filters for smaller companies with stronger financial underpinnings.
- Target quality at a discount by reviewing the 180 high quality undervalued stocks that focuses on solid businesses trading below their implied worth.
- Prioritise resilience by checking the 227 resilient stocks with low risk scores that highlights companies with lower overall risk profiles and steadier fundamentals.
This article by Simply Wall St is general in nature. We provide commentary based on historical data and analyst forecasts only using an unbiased methodology and our articles are not intended to be financial advice. It does not constitute a recommendation to buy or sell any stock, and does not take account of your objectives, or your financial situation. We aim to bring you long-term focused analysis driven by fundamental data. Note that our analysis may not factor in the latest price-sensitive company announcements or qualitative material. Simply Wall St has no position in any stocks mentioned.
Have feedback on this article? Concerned about the content? Get in touch with us directly. Alternatively, email editorial-team@simplywallst.com