
- PRICING
- LIVE QUOTES
- LEARN
- HELP


EN
SLM (SLM) Stock Still Looks Below Fair Value As Earnings Drive The Debate
SLM Corporation has seen a sharp pullback in recent months, yet the longer term return picture is very different. This puts fresh attention on what investors are really paying for its earnings today. With the stock now around US$23.05, the key issue is how that price lines up with the profit engine of the underlying lending and servicing business.
- Over the past 3 years, SLM has delivered a gain of about 81.5%, which makes it important to test whether that performance still lines up with the earning power that underpins the valuation.
- The company’s model depends heavily on how efficiently it converts its loan book into sustainable profit, so any shift in credit quality, funding costs, or fee income can meaningfully change what a given P/E multiple implies for long term investors.
- There is a second opinion on SLM worth weighing. See what analysts think SLM's shares could be worth.
For investors, the debate is whether SLM’s current share price can be fully explained by its earnings profile when judged against the Fair Ratio benchmark.
To see whether the same earnings test you are applying to SLM also flags other opportunities, scan the 30 high quality undervalued stocks.
Does SLM Look Undervalued on Earnings?
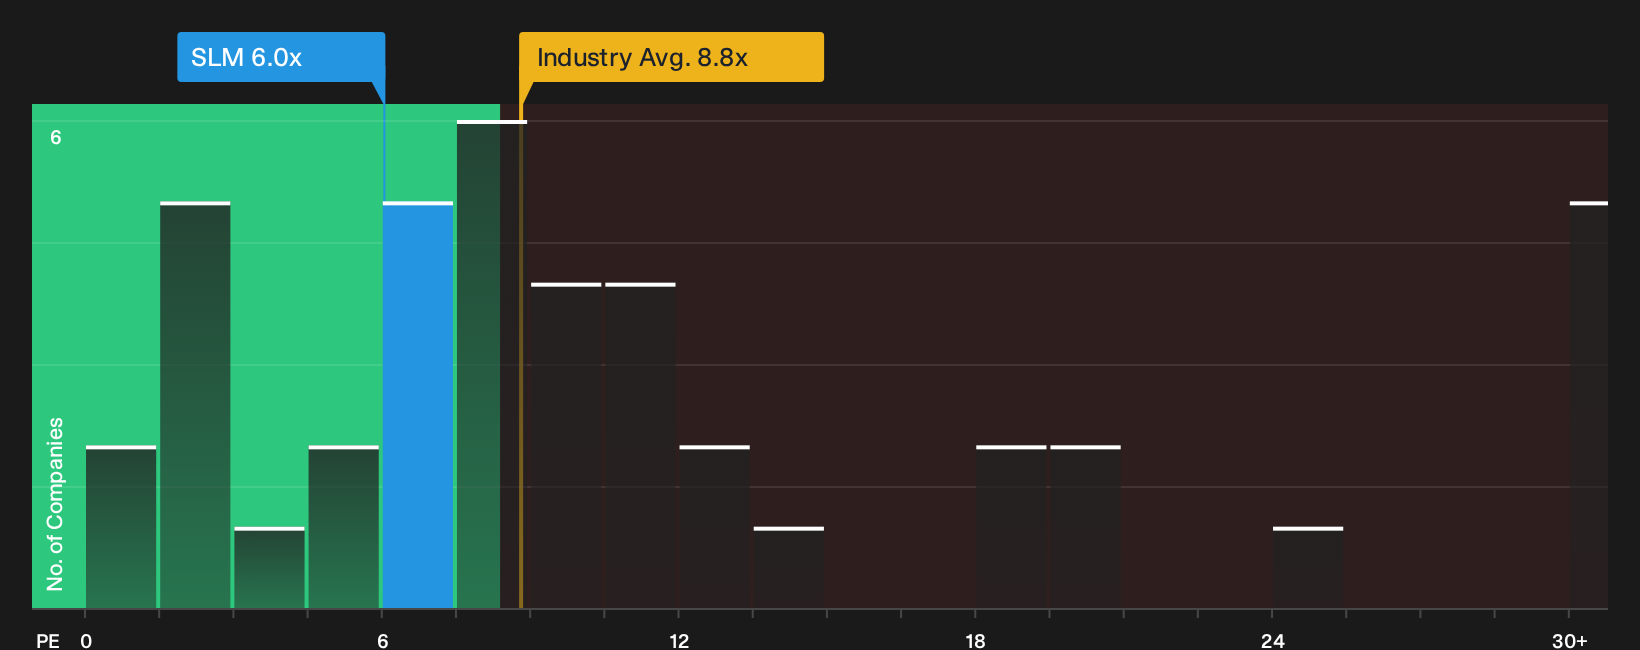
P/E fits SLM because earnings remain the main anchor for how investors judge a lender’s loan book and fee streams. At roughly 6.0x P/E, the stock trades below the Consumer Finance sector average of about 8.8x, so the market is assigning a lower price tag per dollar of earnings than it does for the typical listed lender.
The picture looks even more conservative when set against the peer group on roughly 10.5x and the Fair Ratio model, which blends SLM’s growth outlook, profitability profile and risk markers into a tailored benchmark. Since the current P/E sits well below that fair multiple, the shares screen as undervalued on this earnings lens, leaving the gap between price and modelled worth for you to judge in light of your own risk tolerance and time horizon. Explore the numbers behind SLM's P/E valuation.
The SLM Narrative: What Would Justify Today's Price?
Narratives on Simply Wall St pick up where the P/E puzzle for SLM Corporation leaves off and explain which potential future paths in growth, margins and earnings would need to occur for SLM's stock to be worth substantially more or less than today’s price. Each scenario links its number to a concrete view of how SLM's growth, profitability and risk profile could evolve, giving you something specific to revisit when new information becomes available.
Community narratives on SLM Corporation split between those who see more upside left in the model and those who view it as roughly fairly priced with meaningful risks.
Bull case: 34% undervalued
"Management expects a multiyear partnership in private credit that uses SLM's customer base and is intended to grow capital light fee-based revenues, which directly supports earnings with less balance sheet usage..."
Discover why this Narrative puts SLM at 34% undervalued.
Bear case: roughly fairly valued
"The strategy of aggressive capital return via buybacks combined with modest balance sheet growth, in the face of potentially volatile gain on sale economics and ABS spread cycles, could leave limited capital flexibility to absorb adverse credit or funding shocks..."
Explore why this Narrative puts SLM at roughly fairly valued.
SLM Corporation’s valuation still leaves one critical angle unexplored
Price, earnings and risk only tell part of the story for SLM Corporation, because the decisions come from the people in charge and the way they are rewarded for those calls. See who runs SLM and how they are paid.
This article by Simply Wall St is general in nature. We provide commentary based on historical data and analyst forecasts only using an unbiased methodology and our articles are not intended to be financial advice. It does not constitute a recommendation to buy or sell any stock, and does not take account of your objectives, or your financial situation. We aim to bring you long-term focused analysis driven by fundamental data. Note that our analysis may not factor in the latest price-sensitive company announcements or qualitative material. Simply Wall St has no position in any stocks mentioned.
Have feedback on this article? Concerned about the content? Get in touch with us directly. Alternatively, email editorial-team@simplywallst.com