
- PRICING
- LIVE QUOTES
- LEARN
- HELP


EN
Is International Bancshares (IBOC) A Bargain Following Its Recent Pullback?
International Bancshares (IBOC) has drawn fresh attention after recent share moves, with the price closing at $69.39. Investors are weighing that level against its reported intrinsic discount and long term total return record.
Across the past few months International Bancshares has seen its share price give back some ground, with the 90 day share price return down 10.83%, even as the year to date share price return of 3.82% and a 5 year total shareholder return of 87.78% point to momentum built over a longer horizon.
Compare International Bancshares' recent pullback with other hand picked regional lenders by scanning our list of solid balance sheet and fundamentals (24 results) that have held up through similar price swings.
International Bancshares now trades at a reported 50% discount to intrinsic value and about 25% below analyst targets after that pullback. Is the market correctly pricing risk, or is caution overshooting the fundamentals?
Preferred P/E of 10.4x: Is it justified?
International Bancshares looks inexpensive on one common yardstick, with the shares trading on a P/E of 10.4x while the last close sits at $69.39. That level lines up against both the SWS DCF fair value estimate of $139.71 and the bank sector reference points investors often use when judging listed lenders.
The P/E ratio links the current share price to earnings per share and is a quick way to see how much you are paying for each dollar of profit. For a regional bank like International Bancshares, this matters because earnings are shaped by credit quality, funding costs, and fee income rather than fast expanding sales, so investors often lean on P/E to compare across peers.
With earnings up 12.2% per year over the past 5 years but only 0.3% in the last twelve months, the market may be assigning a cautious P/E to International Bancshares as it weighs the recent slowdown. High quality earnings, a 2.1% dividend, and a reported 50.3% discount to SWS estimated fair value sit on one side of the ledger, while a 12.2% return on equity that is described as low, 3% bad loans, and a 57% allowance for those problem assets sit on the other.
Against the US Banks industry average P/E of 11.5x and a peer average of 20.4x, the 10.4x multiple looks materially lower and signals the market is pricing International Bancshares more conservatively than both its broader sector and closer comparables. The SWS DCF model result that puts future cash flow value at $139.71 per share reinforces the picture of a valuation that is flagged as good value on several fronts rather than stretched.
See what the numbers say about this price — find out in our valuation breakdown.
Result: Preferred multiple of 10.4x P/E (UNDERVALUED)
Still, credit issues around 3% bad loans and only 57% coverage, along with any shift in analyst targets, could challenge the valuation case for International Bancshares.
Find out about the key risks to this International Bancshares narrative.
Another View on International Bancshares' value
The SWS DCF model points to a future cash flow value of $139.71 per International Bancshares share against the current $69.39 price. That indicates the stock is flagged as undervalued on cash flow, even though earnings growth has slowed and one-year returns have lagged the wider US market. It is unclear whether that gap reflects real mispricing or a higher level of risk around bad loans and margins.
Look into how the SWS DCF model arrives at its fair value.
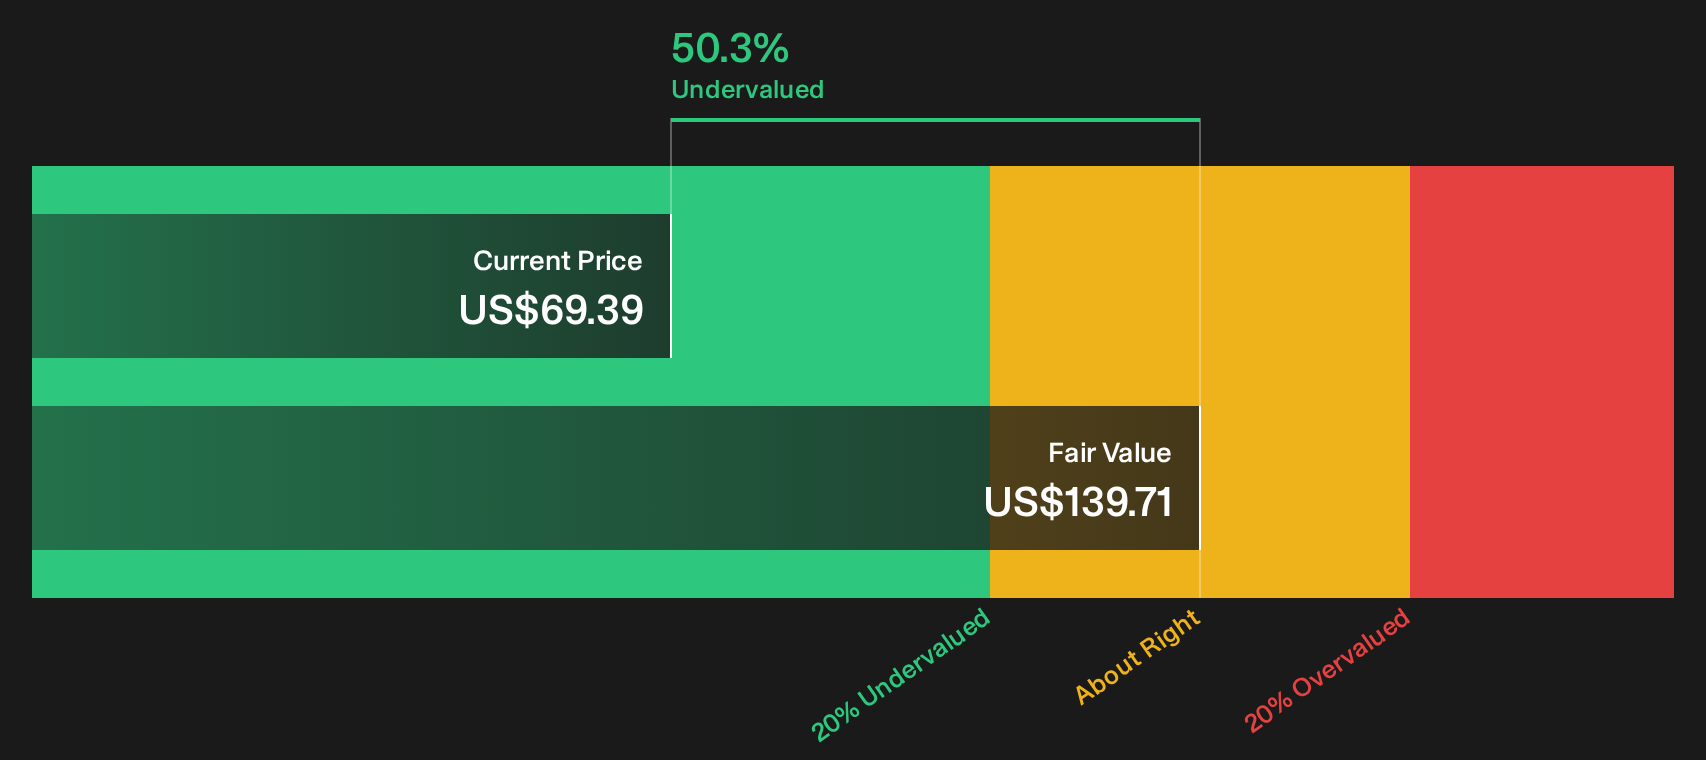
Simply Wall St performs a discounted cash flow (DCF) on every stock in the world every day (check out International Bancshares for example). We show the entire calculation in full. You can track the result in your watchlist or portfolio and be alerted when this changes, or use our stock screener to discover 30 high quality undervalued stocks. If you save a screener we even alert you when new companies match - so you never miss a potential opportunity.
Next Steps
Mixed signals on International Bancshares so far. If you want to act before sentiment shifts again, weigh the potential benefits and drawbacks by reviewing the 3 key rewards and 2 important warning signs
Looking for more investment ideas beyond International Bancshares?
If the International Bancshares story has you thinking about what else might be hiding in plain sight, do not stop your research here. Fresh ideas often show up where pricing, balance sheets, and risk profiles quietly point in different directions from the crowd.
- Target resilience by scanning a curated 30 resilient stocks with low risk scores that filters for businesses with lower risk scores when markets start rewarding consistency over excitement.
- Hunt for value by reviewing a focused 30 high quality undervalued stocks that highlights companies with strong fundamentals that the market may not be fully pricing in yet.
- Strengthen your income stream by checking a hand picked 8 dividend fortresses that zeroes in on higher yielding payers built around more robust payout profiles.
Do not wait for the next headline to push you into action. Use these screeners today to line up a watchlist of ideas before others start paying attention.
This article by Simply Wall St is general in nature. We provide commentary based on historical data and analyst forecasts only using an unbiased methodology and our articles are not intended to be financial advice. It does not constitute a recommendation to buy or sell any stock, and does not take account of your objectives, or your financial situation. We aim to bring you long-term focused analysis driven by fundamental data. Note that our analysis may not factor in the latest price-sensitive company announcements or qualitative material. Simply Wall St has no position in any stocks mentioned.
Have feedback on this article? Concerned about the content? Get in touch with us directly. Alternatively, email editorial-team@simplywallst.com