
- PRICING
- LIVE QUOTES
- LEARN
- HELP


EN
Applied Optoelectronics (AAOI) Stock Could Be Below Fair Value Today
Applied Optoelectronics has delivered very strong share-price gains in recent years, which puts fresh focus on whether its current US$101.03 level can be explained by its sales rather than just market enthusiasm. With that kind of move in the rear-view mirror, the key issue is how much revenue investors are effectively paying for today.
- Over the past 5 years the stock has returned about 13x, which raises the question of how much of that move is supported by the company’s sales base.
- The business relies heavily on converting optical networking demand into sustainable revenue, so future expectations for sales quality and consistency may matter more than short-term price swings.
- The analysts covering Applied Optoelectronics have run their own numbers. See what analysts think Applied Optoelectronics's shares could be worth.
The issue now is whether Applied Optoelectronics’ current valuation is justified by its sales when you line it up against the Fair Ratio benchmark.
If you want to stress test whether Applied Optoelectronics is the only story on your radar at this kind of sales multiple, line it up against 30 high quality undervalued stocks
Is Applied Optoelectronics a Bargain on Sales?
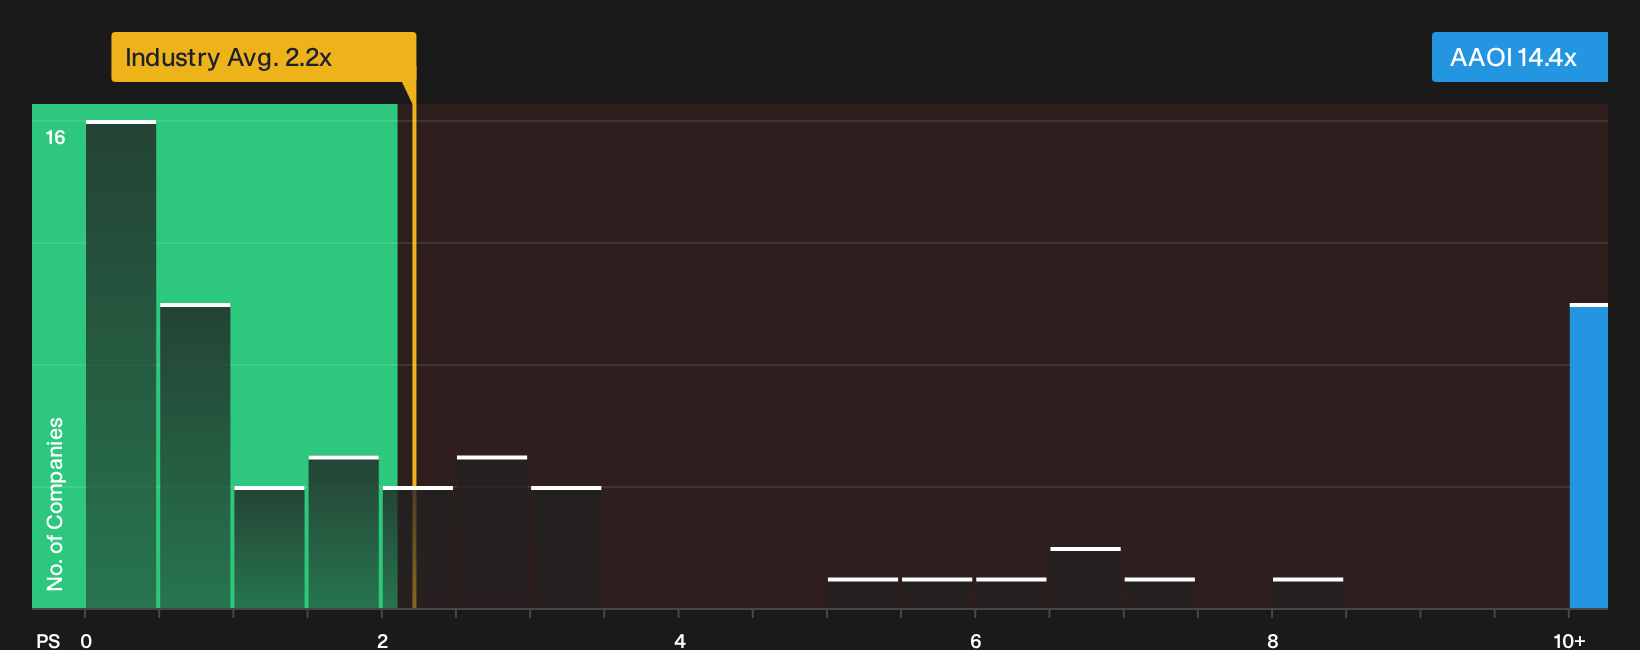
P/S is a cleaner lens for Applied Optoelectronics because the business is still working through losses, so revenue gives a more stable anchor than earnings or free cash flow. On this metric, the stock trades on a P/S of about 14.4x, which is well above the broader communications industry average of roughly 2.2x and also ahead of the peer group around 6.6x. That kind of gap suggests investors are willing to pay a sizeable premium for each dollar of sales.
The Fair Ratio model, which considers Applied Optoelectronics’ mix of growth prospects, margins, size and risk profile, indicates a higher P/S than where the shares change hands today. This means the current multiple sits below what this more tailored framework would imply, even after taking into account the stock’s premium to sector and peer benchmarks. Anyone weighing the valuation will need to decide whether the quality and durability of future revenue can support that kind of spread over simpler averages. Explore the numbers behind Applied Optoelectronics's P/S valuation.
The Applied Optoelectronics Narrative: What Would Justify Today's Price?
Simply Wall St Narratives for Applied Optoelectronics pick up where the valuation puzzle leaves off. They spell out which combinations of future growth, margins and earnings would need to play out for the stock to be worth materially more or materially less than today’s price on the Community page. Instead of a single output from a ratio or model, they map the set of business outcomes that number depends on so you can follow over time whether those conditions still look credible.
Community views around Applied Optoelectronics pull in opposite directions, with one group seeing substantial upside and another flagging meaningful downside risk.
Bull case: 38% undervalued
"Rising demand for AI/ML workloads, video streaming, IoT, and ongoing transition from copper to fiber in networking infrastructure creates sustained industry tailwinds..."
Discover why this Narrative puts Applied Optoelectronics at 38% undervalued.
Bear case: 30% overvalued
"The short thesis is equally clear: the stock now discounts a large part of that upside already, with investors underwriting near-flawless execution..."
Explore why this Narrative puts Applied Optoelectronics at 30% overvalued.
One more Applied Optoelectronics check that belongs beside the price tag
After comparing today’s P/S to peers and the Fair Ratio view, the next filter is where professional forecasts expect Applied Optoelectronics to be a few years from now, and how that lines up with what you are paying today. Explore where analysts expect Applied Optoelectronics to be in a few years.
This article by Simply Wall St is general in nature. We provide commentary based on historical data and analyst forecasts only using an unbiased methodology and our articles are not intended to be financial advice. It does not constitute a recommendation to buy or sell any stock, and does not take account of your objectives, or your financial situation. We aim to bring you long-term focused analysis driven by fundamental data. Note that our analysis may not factor in the latest price-sensitive company announcements or qualitative material. Simply Wall St has no position in any stocks mentioned.
Have feedback on this article? Concerned about the content? Get in touch with us directly. Alternatively, email editorial-team@simplywallst.com