
- PRICING
- LIVE QUOTES
- LEARN
- HELP


EN
Is Evergy (EVRG) Undervalued Or Is Its Grid Investment Story Already Priced In?
Evergy (EVRG) has pulled back recently, with the share price closing at US$77.66 and declining over the past week, month and past 3 months. This gives investors fresh context for reassessing this regulated utility.
Over the short term, Evergy’s share price momentum has cooled, with the stock down over the past week, month and quarter, yet the year-to-date share price return remains positive and the 1-year and multi year total shareholder returns are still in the black.
Scan for other regulated utilities with fresh momentum setups by running the 39 power grid technology and infrastructure stocks alongside Evergy in your watchlist.
For Evergy, a short-term slide sits next to solid multi year shareholder returns and ongoing earnings. Is this pullback about sentiment resetting, or does it hint at a richer valuation than the business now supports?
Most Popular Narrative: 15% Undervalued
Evergy’s most followed narrative pegs fair value at about $91.27 per share, which sits above the recent $77.66 close and frames the latest pullback as a discount rather than a warning signal.
Accelerated investment in grid modernization and new generation capacity is reflected in Evergy's current plan to deploy about US$21.6b from 2026 to 2030 plus roughly US$1b of additional generation capital. This is associated with a projected rate base CAGR of about 12% and is expected to support long-term earnings growth.
See why 14 investors see Evergy as 15% undervalued.
Result: Fair Value of $91.27 (UNDERVALUED)
Still, the Evergy story could change quickly if large data center and industrial loads ramp more slowly than expected or if regulators take a tougher stance on customer bill increases.
Find out about the key risks to this Evergy narrative.
Another View: SWS DCF Puts Evergy In A Different Light
Analyst targets frame Evergy as undervalued at $77.66 against a fair value of $91.27. The SWS DCF model points the other way, with an estimate of $61.24 that suggests the share price sits above the implied future cash flow value. Which yardstick do you trust more: earnings multiples or cash flows?
To unpack how that cash flow outcome is built and what would need to change for the gap to close, review the Look into how the SWS DCF model arrives at its fair value..
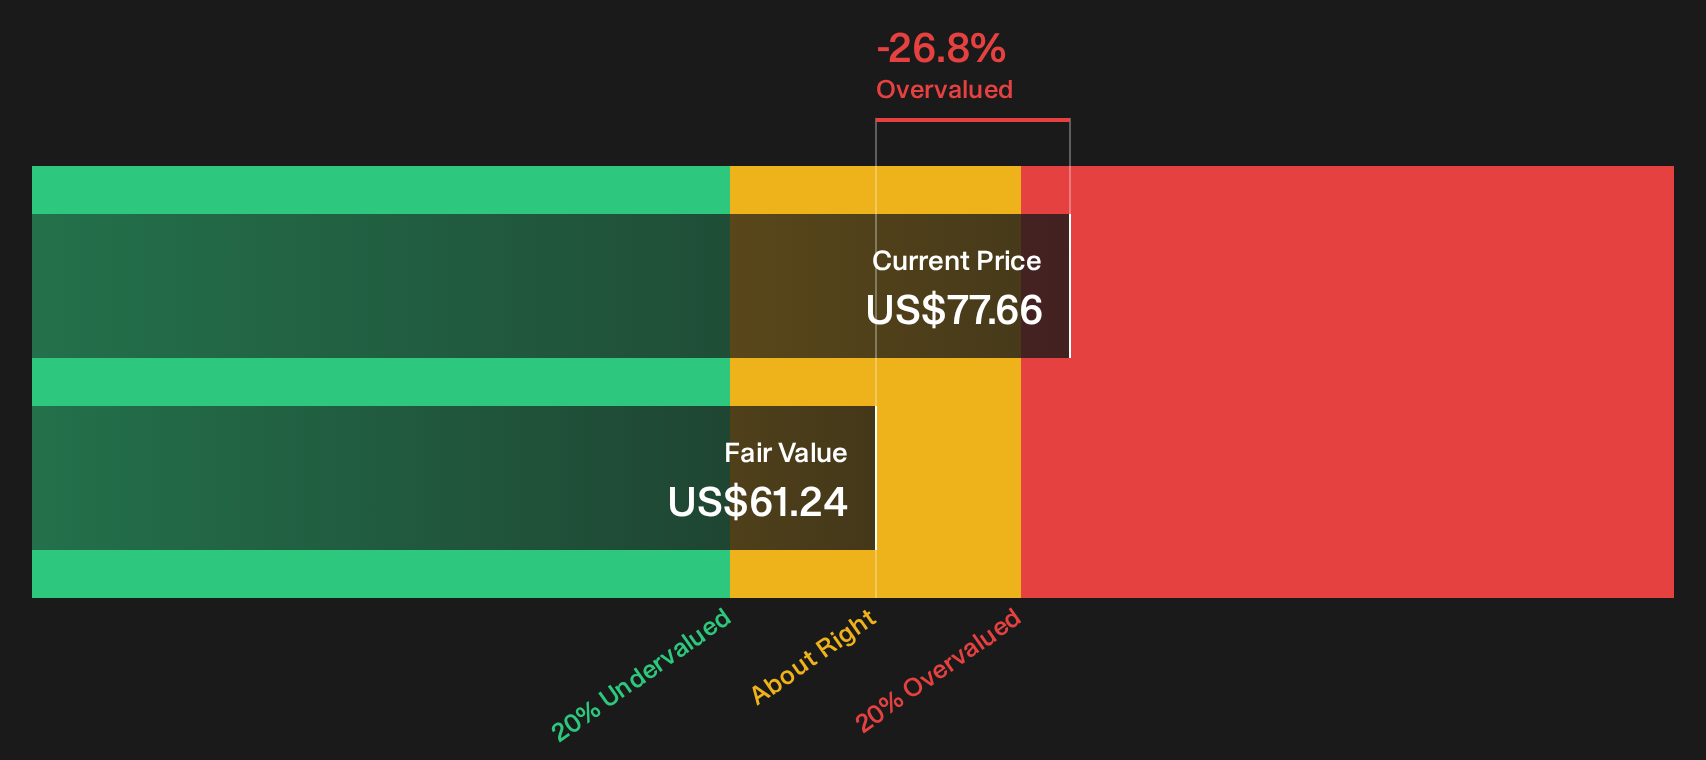
Simply Wall St performs a discounted cash flow (DCF) on every stock in the world every day (check out Evergy for example). We show the entire calculation in full. You can track the result in your watchlist or portfolio and be alerted when this changes, or use our stock screener to discover 30 high quality undervalued stocks. If you save a screener we even alert you when new companies match - so you never miss a potential opportunity.
Next Steps
If this Evergy debate leaves you split between potential risks and rewards, move quickly, review the data in full, and weigh the 2 key rewards and 2 important warning signs.
Looking for more Evergy-sized investment ideas?
Evergy gives useful context, but your next strong decision might come from widening the lens, testing new watchlist candidates, and stress testing your portfolio with fresh ideas.
- Chase upside potential in quality names that may be overlooked by the market by scanning our 16 high quality undiscovered gems.
- Prioritise resilience and capital preservation by filtering for companies on the 30 resilient stocks with low risk scores that could help smooth out portfolio volatility.
- Target robust fundamentals and financial strength by building a shortlist from the list of solid balance sheet and fundamentals (24 results) while Evergy stays on your radar.
This article by Simply Wall St is general in nature. We provide commentary based on historical data and analyst forecasts only using an unbiased methodology and our articles are not intended to be financial advice. It does not constitute a recommendation to buy or sell any stock, and does not take account of your objectives, or your financial situation. We aim to bring you long-term focused analysis driven by fundamental data. Note that our analysis may not factor in the latest price-sensitive company announcements or qualitative material. Simply Wall St has no position in any stocks mentioned.
Have feedback on this article? Concerned about the content? Get in touch with us directly. Alternatively, email editorial-team@simplywallst.com