
- PRICING
- LIVE QUOTES
- LEARN
- HELP


EN
Transocean (RIG) Wins Deepwater Conqueror Contract, Is The Stock Still Undervalued?
Transocean’s new Deepwater Conqueror contract
Transocean (RIG) shares are drawing attention after the company disclosed a new two-well contract for the Deepwater Conqueror in Equatorial Guinea. The 170-day campaign adds about $80 million to backlog from 2027.
Against that contract win, Transocean’s share price has eased in the short term, with a 7-day share price return of 4.06% and a 30-day share price return of 5.57%, even as the year-to-date share price return sits at 28.07% and the 1-year total shareholder return is 71.84%. This points to momentum that has cooled recently but remains strong over the past year.
Compare Transocean’s backlog-driven story with other offshore and energy contractors by scanning our hand picked list of solid balance sheet and fundamentals (24 results) that could benefit if demand for drilling stays firm.
Transocean now has fresh backlog visibility and a share price that has cooled over the past month. Is this a reasonable entry point, or does it make more sense to wait for a cheaper shot at the same cash flows?
Most Popular Narrative: 40% Undervalued
Relative to the last close at $5.43, the most followed narrative on Transocean pegs fair value closer to $9.00 per share. This frames the latest Deepwater Conqueror contract against a much larger balance sheet and fleet story.
In 2008, Transocean ran 136 rigs. It earned $4.2 billion. The stock traded at $150. Today the stock trades under $6. And after the Valaris merger closes, the company will run 73 rigs. Half the fleet. The market looks at that and sees a company that shrank. I looked at that for a week with pen and paper and saw something else. So let me show you the count.
See why 6 investors see Transocean as 40% undervalued.
Result: Fair Value of $9.00 (UNDERVALUED)
Still, Transocean’s story can break if offshore dayrates soften before debt is reduced or if the Valaris merger is delayed or blocked by regulators.
Find out about the key risks to this Transocean narrative.
Another View On Transocean’s Value
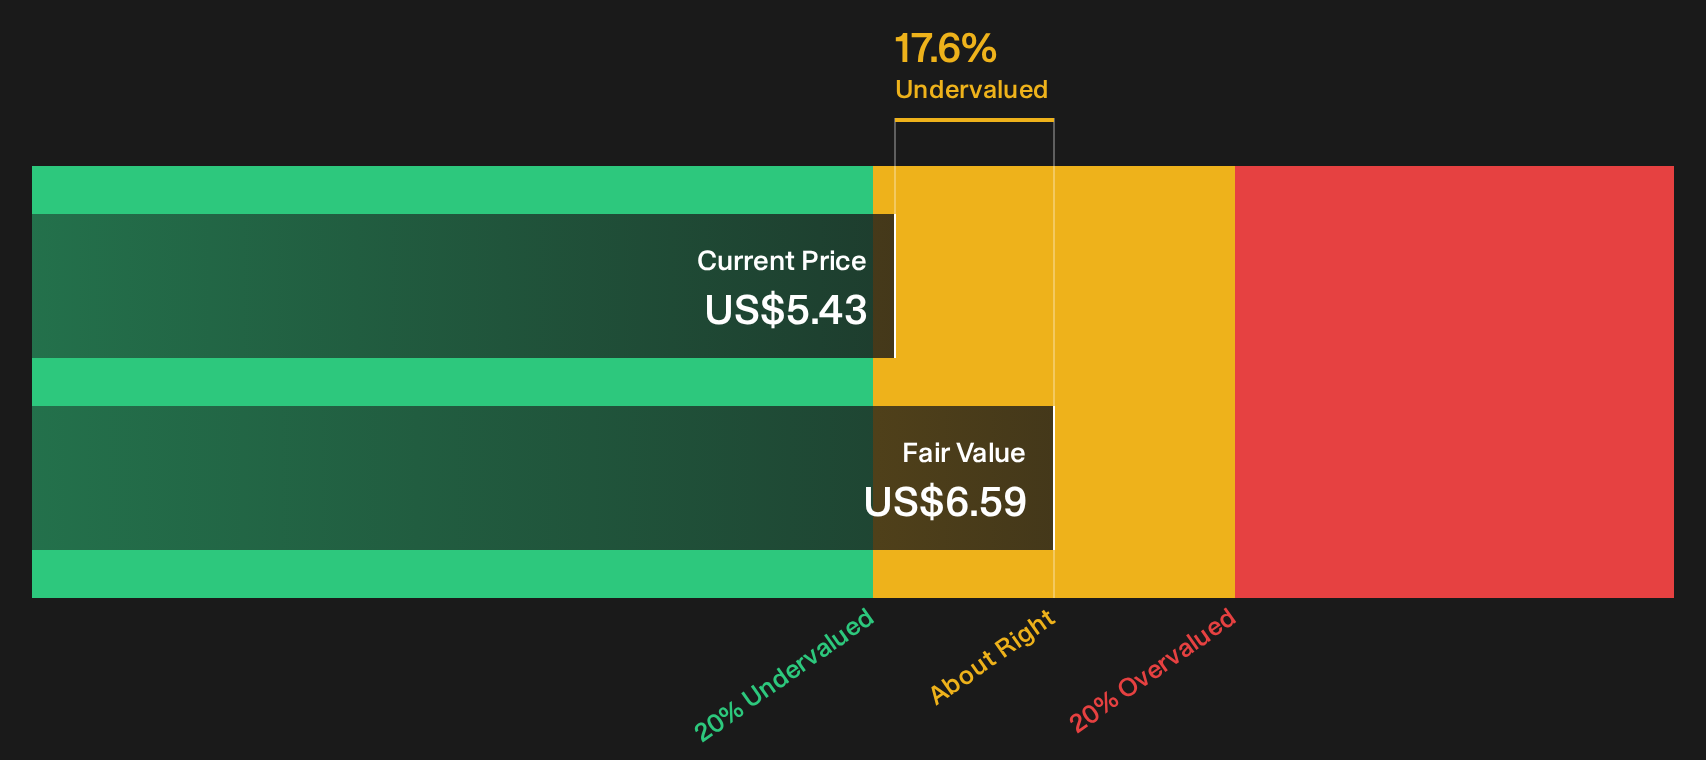
There is a second lens investors are using for Transocean. The SWS DCF model, which estimates value from future cash flows, points to a fair value near $6.59 per share versus the current $5.43. That still suggests the stock is undervalued, but by a much smaller margin than the $9.00 narrative. Which signal do you trust more: the spreadsheet tied to cash flow, or the rig-by-rig story?
For anyone weighing these two approaches side by side, it can help to see how the SWS DCF model is actually built and what assumptions sit under that $6.59 number. Look into how the SWS DCF model arrives at its fair value.
Next Steps
Plenty in this Transocean story points both ways, with upbeat cash flow narratives on one side and real balance sheet and execution questions on the other. If you want to see how those trade offs stack up in the data, start by weighing the 2 key rewards and 1 important warning sign.
Looking for more Transocean-style investment ideas?
If you like the risk reward profile around Transocean and want fresh angles, you can use the Simply Wall St screener to surface other candidates before the crowd spots them.
- Target potential bargains with strong fundamentals by scanning a curated set of 16 high quality undiscovered gems that might not be widely followed yet.
- Focus on durability and capital protection by reviewing a 30 resilient stocks with low risk scores that filters for businesses with resilient financial profiles.
- Hunt for resilient balance sheets by checking a list of solid balance sheet and fundamentals (24 results) that highlights companies with cleaner debt and funding positions.
This article by Simply Wall St is general in nature. We provide commentary based on historical data and analyst forecasts only using an unbiased methodology and our articles are not intended to be financial advice. It does not constitute a recommendation to buy or sell any stock, and does not take account of your objectives, or your financial situation. We aim to bring you long-term focused analysis driven by fundamental data. Note that our analysis may not factor in the latest price-sensitive company announcements or qualitative material. Simply Wall St has no position in any stocks mentioned.
Have feedback on this article? Concerned about the content? Get in touch with us directly. Alternatively, email editorial-team@simplywallst.com