
- PRICING
- LIVE QUOTES
- LEARN
- HELP


EN
Is Brilliance China Automotive Holdings (SEHK:1114) Cheap Following Its FTSE All World Index Removal?
Index removal puts Brilliance China Automotive Holdings back under the microscope
Brilliance China Automotive Holdings (SEHK:1114) has been dropped from the FTSE All-World Index (USD), a move that can trigger portfolio reshuffling by investors who track that global benchmark.
Recent trading has been choppy for Brilliance China Automotive Holdings. The HK$1.805 share price has seen a 1-day share price return of 2.27% and a 7-day share price return of 4.34%, yet the 30-day share price return is down 27.66% and the year-to-date share price return is down 55.65%, while the 3-year total shareholder return of 157.00% contrasts sharply with the 1-year total shareholder return, which is down 40.99%. This suggests that momentum has faded in the short term even after a strong multi-year run.
Scan other auto and industrial stocks that may be moving on similar index reshuffles by reviewing the hand picked 619 high quality undiscovered gems alongside Brilliance China Automotive Holdings.
For Brilliance China Automotive Holdings, the index exit and sharp pullback could point to doubts over the business itself, or simply to souring sentiment on the stock. The valuation section evaluates which explanation is more consistent with the available information.
Price-to-earnings of 7.3x for Brilliance China Automotive Holdings: Is it justified?
On simple earnings terms, Brilliance China Automotive Holdings trades on a P/E of 7.3x, which is well below both the Hong Kong market and the Asian auto peer group, even after the recent drop to HK$1.805.
The P/E ratio compares the HK$1.805 share price with the earnings generated per share. It effectively reflects what investors are willing to pay today for each dollar of current profit. For a business that manufactures and sells BMW and non-BMW vehicles and components, this metric is closely watched because it ties the share price directly to ongoing profitability rather than short term trading moves.
A 7.3x multiple versus the Hong Kong market average of 10.8x suggests the stock is priced at a discount to the broader market. The gap widens further against the Asian auto industry average of 13.4x. The fair P/E estimate of 9.1x also sits meaningfully higher than the current level, which indicates the valuation could move toward that fair ratio if earnings quality and outlook remain consistent with the current assessment.
Explore the SWS fair ratio for Brilliance China Automotive Holdings.
Result: Price-to-earnings of 7.3x (UNDERVALUED)
Still, the index exit and year to date share price decline of 55.65% signal that sentiment toward Brilliance China Automotive Holdings can weaken further if earnings or partnerships disappoint.
Find out about the key risks to this Brilliance China Automotive Holdings narrative.
Another view on Brilliance China Automotive Holdings’ valuation
On the flip side, the SWS DCF model paints a very different picture. At HK$1.81, Brilliance China Automotive Holdings is trading well above an estimated future cash flow value of HK$0.26 per share, which implies the stock screens as overvalued on this framework.
This kind of gap between an earnings based multiple and a cash flow model can signal either a quality premium that the P/E does not fully capture or cash flow assumptions that are too cautious. It raises a simple question for investors: Which lens feels more reliable for a capital intensive auto manufacturer with joint ventures and complex funding?
Look into how the SWS DCF model arrives at its fair value.
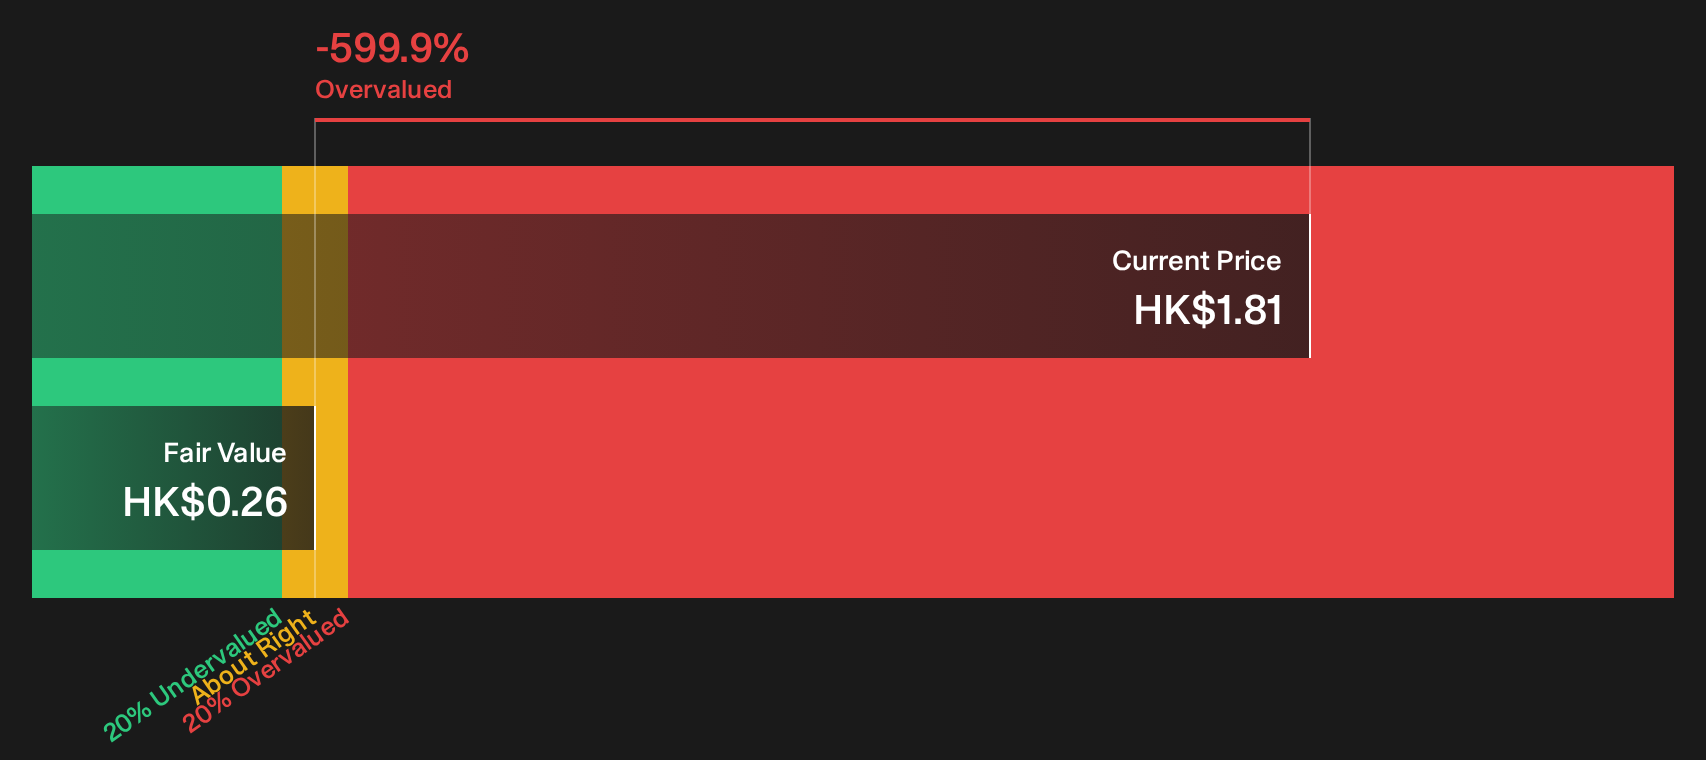
Simply Wall St performs a discounted cash flow (DCF) on every stock in the world every day (check out Brilliance China Automotive Holdings for example). We show the entire calculation in full. You can track the result in your watchlist or portfolio and be alerted when this changes, or use our stock screener to discover 179 high quality undervalued stocks. If you save a screener we even alert you when new companies match - so you never miss a potential opportunity.
Next Steps
Mixed signals around Brilliance China Automotive Holdings are clear, so move quickly, review the full data set, and weigh both sides of the story with 3 key rewards and 2 important warning signs
Looking for more investment ideas beyond Brilliance China Automotive Holdings?
Do not stop your research with Brilliance China Automotive Holdings. Fresh opportunities appear when you compare different businesses side by side using focused screeners that highlight specific strengths.
- Target higher potential upside by scanning 131 elite penny stocks with strong financials that already show stronger fundamentals than many micro caps in the market.
- Prioritise quality at a sensible price and review the 179 high quality undervalued stocks that combine healthier balance sheets with more attractive valuations.
- Lean toward resilience and capital preservation by checking the 229 resilient stocks with low risk scores that score better on financial strength and stability.
This article by Simply Wall St is general in nature. We provide commentary based on historical data and analyst forecasts only using an unbiased methodology and our articles are not intended to be financial advice. It does not constitute a recommendation to buy or sell any stock, and does not take account of your objectives, or your financial situation. We aim to bring you long-term focused analysis driven by fundamental data. Note that our analysis may not factor in the latest price-sensitive company announcements or qualitative material. Simply Wall St has no position in any stocks mentioned.
Have feedback on this article? Concerned about the content? Get in touch with us directly. Alternatively, email editorial-team@simplywallst.com