
- PRICING
- LIVE QUOTES
- LEARN
- HELP


EN
CorVel (CRVL) Has A Fresh Update, But What Should Investors Make Of It?
Why CorVel’s CareMC Accelerator launch matters for investors
CorVel (CRVL) has rolled out its CareMC Accelerator for Guidewire ClaimCenter, integrating managed care directly into claims workflows and aiming to cut friction, automate data exchange, and simplify carrier operations.
Recent trading has reflected renewed interest in CorVel, with the share price delivering a 17.05% 90-day share price return and a 12.15% year-to-date share price return, even though the 1-year total shareholder return is down 5.97%. This suggests improving short-term momentum following product updates like CareMC Accelerator.
Scan how CorVel’s CareMC Accelerator fits into a wider claims and healthcare technology trend by reviewing the hand-picked 38 healthcare AI stocks that are reshaping how insurers manage cost and care.
Bulls point to CorVel’s CareMC Accelerator and recent share price momentum, while bears worry about whether the excitement outruns fundamentals. Which side looks better supported once the valuation work starts?
Preferred P/E of 32.3x for CorVel: Is it justified?
On simple valuation math, CorVel screens as mixed. The share price closed at $73.73, our DCF model value sits at $65.75, and the stock trades on a P/E of 32.3x that is lower than its direct peers but higher than the broader US Healthcare group.
P/E compares the price investors pay for each dollar of earnings. For a healthcare claims and cost management specialist that leans heavily on software, data and services, P/E tends to be a useful shorthand for how much the market is willing to pay for current profitability.
The numbers here pull in different directions. CorVel is described as good value relative to its peer average P/E of 38.9x, which suggests the market is applying a lower earnings multiple than investors give to similar companies. At the same time, the stock is flagged as expensive against the wider US Healthcare industry average P/E of 23.6x, which points to a richer price tag than the broader sector. This could mean investors are already paying up for CorVel's high quality earnings, 28.2% return on equity and 14.2% per year profit growth over the past 5 years.
Relative to direct peers, the P/E of 32.3x looks more restrained than a 38.9x group average. Compared with the wider industry at 23.6x, it looks demanding. That tension is what investors need to weigh, especially given the stock is also trading above the SWS DCF model output of $65.75 per share.
See what the numbers say about this price — find out in our valuation breakdown.
Result: Price-to-earnings of 32.3x (ABOUT RIGHT)
Still, CorVel relies heavily on a single Managed Care revenue stream and a purely US footprint. As a result, any slowdown in that market could quickly challenge today’s valuation story.
Find out about the key risks to this CorVel narrative.
Another view on CorVel’s value using cash flows
Price multiples paint CorVel as roughly in line with peers, yet the SWS DCF model is more cautious. With the shares at $73.73 and modeled future cash flow value at $65.75, the stock screens as overvalued using this measure. Which yardstick do you trust more when real money is on the line?
Look into how the SWS DCF model arrives at its fair value.
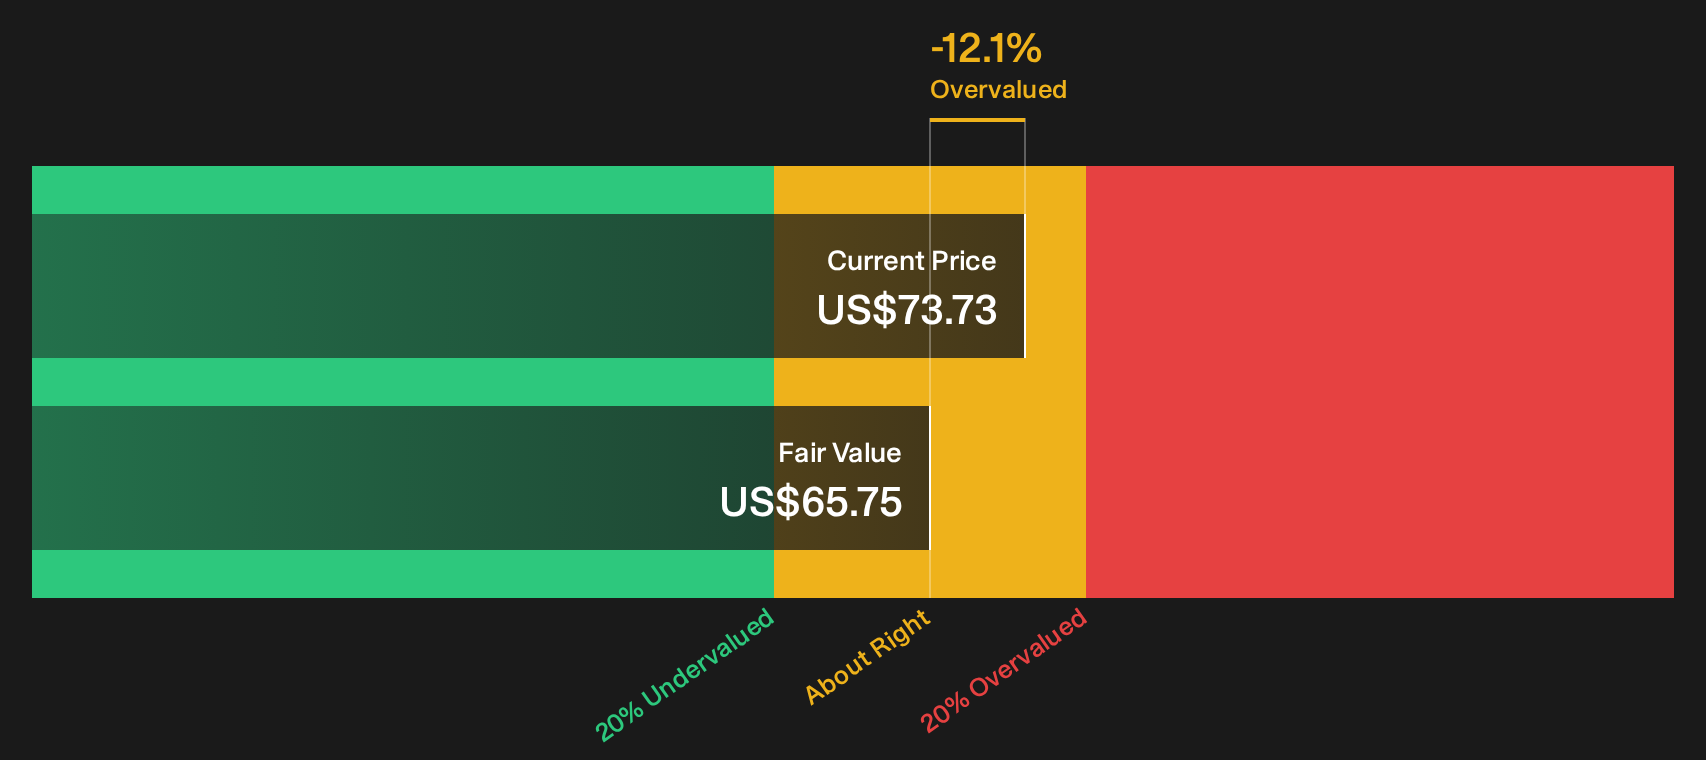
Simply Wall St performs a discounted cash flow (DCF) on every stock in the world every day (check out CorVel for example). We show the entire calculation in full. You can track the result in your watchlist or portfolio and be alerted when this changes, or use our stock screener to discover 30 high quality undervalued stocks. If you save a screener we even alert you when new companies match - so you never miss a potential opportunity.
Next Steps
Mixed signals around CorVel’s valuation and product traction can feel messy. Review the numbers yourself and decide what really matters to you based on the 1 key reward and 1 important warning sign.
Looking for more CorVel-sized investment ideas?
If CorVel has sharpened your focus on quality and valuation, do not stop here. Broaden your watchlist with other targeted ideas that could sharpen your decision making.
- Target resilient balance sheets by scanning a list of solid balance sheet and fundamentals (23 results) that filters for companies built on stronger financial footing.
- Hunt for mispriced quality by reviewing a 30 high quality undervalued stocks that blends solid fundamentals with attractive valuations.
- Spot potential early leaders by checking a 16 high quality undiscovered gems packed with lesser-known businesses that already post strong financials.
This article by Simply Wall St is general in nature. We provide commentary based on historical data and analyst forecasts only using an unbiased methodology and our articles are not intended to be financial advice. It does not constitute a recommendation to buy or sell any stock, and does not take account of your objectives, or your financial situation. We aim to bring you long-term focused analysis driven by fundamental data. Note that our analysis may not factor in the latest price-sensitive company announcements or qualitative material. Simply Wall St has no position in any stocks mentioned.
Have feedback on this article? Concerned about the content? Get in touch with us directly. Alternatively, email editorial-team@simplywallst.com