
- PRICING
- LIVE QUOTES
- LEARN
- HELP


EN
OMRON (TSE:6645) Rebounds Strongly, Is The Valuation Already Too Rich?
Recent trading in OMRON (TSE:6645) has drawn fresh attention after a 2.6% one day gain and a year to date total return above 58%, prompting a closer look at its fundamentals.
That 1 day uplift sits within a strong year to date share price return of 58.36%. The 90 day gain of 12.76% suggests momentum is still positive, even though the 30 day share price return declined 2.29%. The 5 year total shareholder return of 38.20% underlines how recent strength in OMRON contrasts with a much weaker longer run experience.
Scan beyond OMRON and see how other robotics and automation players are moving with our hand picked list of 93 robotics and automation stocks
OMRON now trades about 10% below the average analyst target, yet its own intrinsic value model points to a premium, not a discount. Is the market showing discipline, or missing something after this sharp rebound?
Price-to-Earnings of 28.6x: Is it justified?
OMRON screens as expensive on some measures and reasonable on others, which is exactly where the 28.6x P/E at ¥6,328 becomes interesting for investors comparing it with both peers and its own earnings profile.
The P/E ratio compares the current share price with earnings per share and is a simple way of gauging how much investors are paying for each unit of profit. For a business like OMRON that operates across industrial automation, healthcare and social systems, earnings based measures are particularly watched because cash generation and profit quality sit behind long product cycles and sizeable capital needs.
On a peer comparison, the stock is described as good value against a 41x average P/E for similar companies, which signals a lower price tag per unit of earnings than many robotics and automation rivals. At the same time, the SWS fair P/E estimate of 21.7x implies the market is paying a premium to the level that earnings alone might justify, and the shares are also described as expensive compared with the broader JP Electronic industry on 16.3x. These opposing signals suggest the market may be pricing OMRON between sector leaders and the wider electronic group, with potential for that valuation to move closer to the fair ratio if expectations or results change.
Explore the SWS fair ratio for OMRON.
Result: Price-to-Earnings of 28.6x (OVERVALUED)
Still, OMRON’s 5 year shareholder return of 38.20%, combined with recent strength and a P/E above the SWS fair estimate, leaves sentiment exposed to earnings setbacks.
Find out about the key risks to this OMRON narrative.
Another View on OMRON's Value
A second lens comes from the SWS DCF model, which puts OMRON’s future cash flow value at about ¥4,102 per share compared with today’s ¥6,328 price. That gap points to an overvalued stock on this framework. Does that say more about the model’s caution, or about how far sentiment has run ahead of cash generation?
Look into how the SWS DCF model arrives at its fair value.
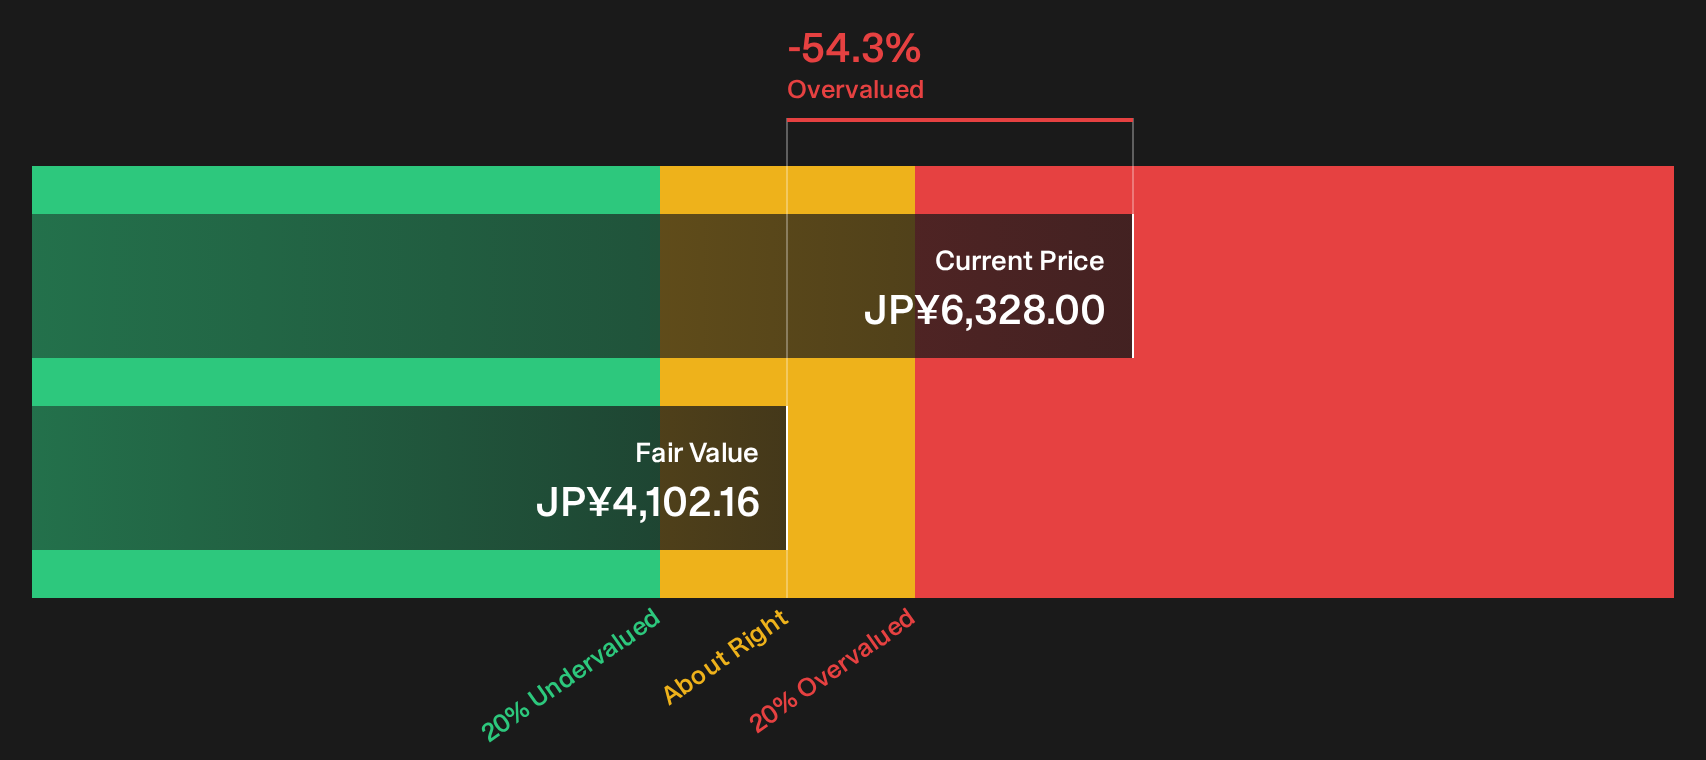
Simply Wall St performs a discounted cash flow (DCF) on every stock in the world every day (check out OMRON for example). We show the entire calculation in full. You can track the result in your watchlist or portfolio and be alerted when this changes, or use our stock screener to discover 17 high quality undervalued stocks. If you save a screener we even alert you when new companies match - so you never miss a potential opportunity.
Next Steps
Mixed signals on OMRON so far. If you want to cut through the noise and act while sentiment is split, start by weighing the 2 key rewards and 1 important warning sign
Looking for more OMRON sized investment ideas?
If OMRON has your attention right now, do not stop with a single ticker when there are broader sets of opportunities you can scan in minutes.
- Target sturdier income streams by reviewing a shortlist of companies that pay sizeable yields and aim for resilience through 15 dividend fortresses.
- Hunt for potential mispricing by scanning a curated pool of quality businesses trading below their fair value using the 17 high quality undervalued stocks.
- Prioritise capital preservation and steadier compounding by running your filters across a group of 21 resilient stocks with low risk scores.
This article by Simply Wall St is general in nature. We provide commentary based on historical data and analyst forecasts only using an unbiased methodology and our articles are not intended to be financial advice. It does not constitute a recommendation to buy or sell any stock, and does not take account of your objectives, or your financial situation. We aim to bring you long-term focused analysis driven by fundamental data. Note that our analysis may not factor in the latest price-sensitive company announcements or qualitative material. Simply Wall St has no position in any stocks mentioned.
Have feedback on this article? Concerned about the content? Get in touch with us directly. Alternatively, email editorial-team@simplywallst.com