
- PRICING
- LIVE QUOTES
- LEARN
- HELP


EN
What H.B. Fuller (FUL)'s Strong Earnings Means For Shareholders
- H.B. Fuller reported third quarter 2026 sales of US$938.18 million and net income of US$79.18 million, along with higher basic and diluted earnings per share from continuing operations compared with the same period in 2025.
- The launch of the Kofinity insulating glass platform, built on the 4SG technology, positions H.B. Fuller more directly in energy efficient building materials with a focus on reducing window seal failures and improving long term thermal performance.
- The next area of attention will be how H.B. Fuller's stronger earnings and the Kofinity launch may influence the broader investment narrative around profitability.
H.B. Fuller Investment Narrative Recap
For an investor to stay with H.B. Fuller, the core belief is that a specialty adhesives producer can keep turning operational discipline into steadier earnings. The third quarter showed higher sales of US$938.18 million and net income of US$79.18 million, with basic EPS from continuing operations at US$1.46. In the short term, the key swing factor is execution on pricing and mix in softer end markets.
The biggest immediate risk still sits with weaker demand in areas like solar and HHC, along with raw material and FX pressures and a relatively high net debt load. On that score, the latest quarter helps sentiment but does not remove those pressures. Management’s 2026 guidance for mid single digit revenue growth keeps expectations measured rather than transformative.
The most relevant announcement here is the 2026 guidance that points to net revenue up mid single digits and organic revenue up low single digits. For readers, that ties directly to how H.B. Fuller frames its near term operating run rate. It signals that management is planning around modest volume and pricing support rather than aggressive acceleration.
That matters when weighing catalysts such as portfolio optimization, cost structure work and the ND Industries acquisition. The earnings print shows those efforts feeding into profit and EPS, while guidance places a practical boundary around how fast the story might move. Execution against that low to mid single digit revenue ambition, without eroding margins or stressing the balance sheet further, now looks like the key test.
H.B. Fuller's analyst narrative points to forecast revenues of US$4.3b and earnings of US$248.3 million by 2029, based on an assumed 7.3% yearly revenue growth rate and an increase in earnings of about US$62.6 million from US$185.7 million today.
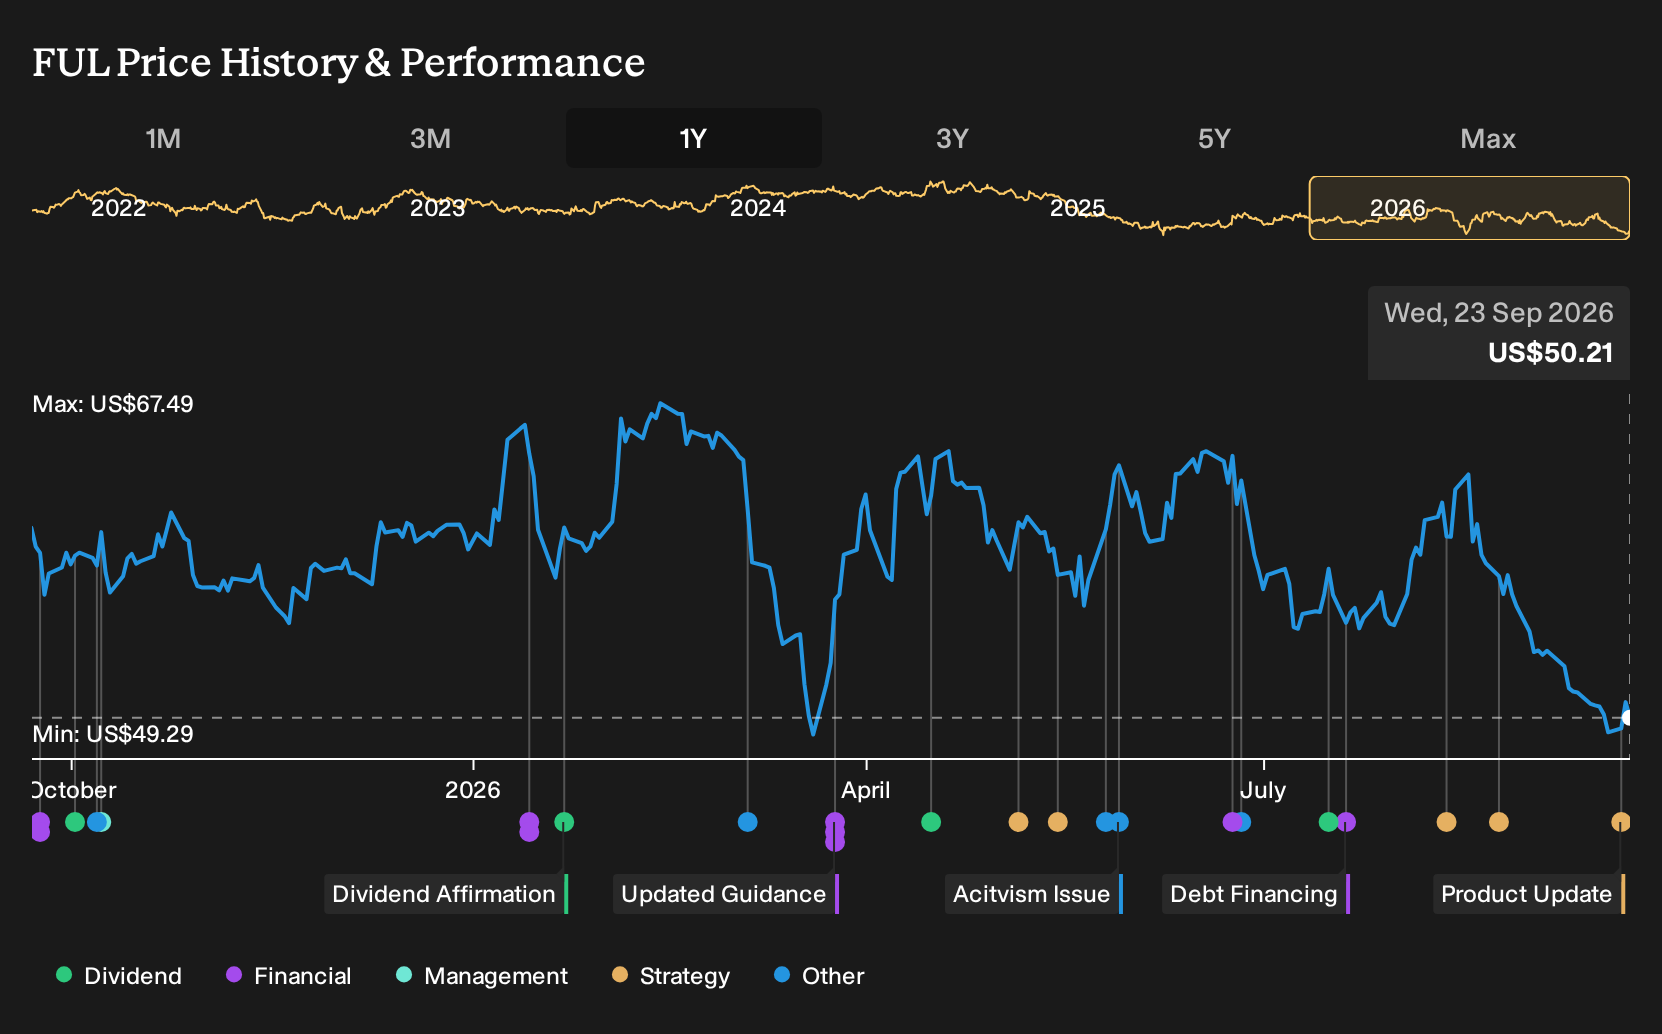
Uncover why H.B. Fuller's fair value indicates a 46% potential upside to its current price before that discount starts to close.
Exploring Other Perspectives
Two fair value estimates from the Simply Wall St Community span roughly US$73 to US$92 per share for H.B. Fuller, which shows how far private investors can diverge when modeling the same adhesives business. When you consider that alongside risks around solar demand, higher raw material costs and a 3.5x net debt to EBITDA ratio, you have a wide field of outcomes. Use that spread as a prompt to explore multiple viewpoints before forming your own stance.
Explore another H.B. Fuller fair value estimate, including one that suggests there could be as much as 84% upside from the current price.
Decide For Yourself
Don't just follow the ticker. Dig into the data and build a conviction that's truly your own.
- A great starting point for your H.B. Fuller research is our analysis highlighting 6 key rewards and 1 important warning sign that could impact your investment decision.
- See our latest analysis for H.B. Fuller. The report includes a comprehensive fundamental analysis summarized in a single visual, the Snowflake, making it easy to evaluate H.B. Fuller's overall financial health at a glance.
Looking for more H.B. Fuller style investment ideas?
If this update on H.B. Fuller has sharpened your thinking, use that momentum to broaden your watchlist with other businesses that share similar balance sheet strength, cash generation or growth profiles.
- For investors who care most about financial resilience and lower balance sheet risk, review a 31 resilient stocks with low risk scores that could help anchor a more stable portfolio core.
- If the aim is to pair quality fundamentals with the chance of finding earlier stage opportunities, scan the 16 high quality undiscovered gems that match your filters on returns, growth and leverage.
- Readers who want a mix of solid finances and room for rerating can turn to a 30 high quality undervalued stocks that flags companies where fundamentals and current pricing look out of sync.
This article by Simply Wall St is general in nature. We provide commentary based on historical data and analyst forecasts only using an unbiased methodology and our articles are not intended to be financial advice. It does not constitute a recommendation to buy or sell any stock, and does not take account of your objectives, or your financial situation. We aim to bring you long-term focused analysis driven by fundamental data. Note that our analysis may not factor in the latest price-sensitive company announcements or qualitative material. Simply Wall St has no position in any stocks mentioned.
Have feedback on this article? Concerned about the content? Get in touch with us directly. Alternatively, email editorial-team@simplywallst.com