
- PRICING
- LIVE QUOTES
- LEARN
- HELP


EN
Gross Margin Gains Might Change The Case For Investing In Snap On (SNA)
- Snap-on reported gross margin of 51.4%, expanding 90 basis points year over year, supported by higher volumes and savings from its Rapid Continuous Improvement program.
- The focus on RCI, sourcing changes and manufacturing efficiency shows how Snap-on is using process discipline to offset tariffs, supply chain friction and inflation pressure.
- We will now look at how Snap-on's margin expansion through Rapid Continuous Improvement could reshape the investment narrative investors focus on.
Scan how Snap-on's margin playbook compares with other process driven manufacturers by reviewing the hand picked list of solid balance sheet and fundamentals (23 results) now focusing on disciplined cost control and cash strength.
Snap-on Investment Narrative Recap
To own Snap-on, you need to believe the business can keep turning its tools, diagnostics and information platform into solid cash flow while defending pricing power. The recent gross margin lift to 51.4% from Rapid Continuous Improvement backs that efficiency story. It supports the short term catalyst many investors watch, resilience in profitability even when volume or mix look less exciting.
The bigger swing factor still sits on the demand side. Slower organic revenue growth and flat EPS keep the risk firmly on topline momentum, especially as technicians face changing technology and more competition in tools. Margin gains alone do not remove exposure to e-commerce, EV tool requirements and purchasing consolidation at large repair groups.
Recent commentary around RCI and sourcing changes is the key operational update that matters here. Snap-on is leaning on process discipline, product mix and manufacturing tweaks to offset tariffs, supply friction and inflation. That makes the efficiency program tightly linked to whether gross margin holds up as diagnostic tools and software become a larger share of the portfolio.
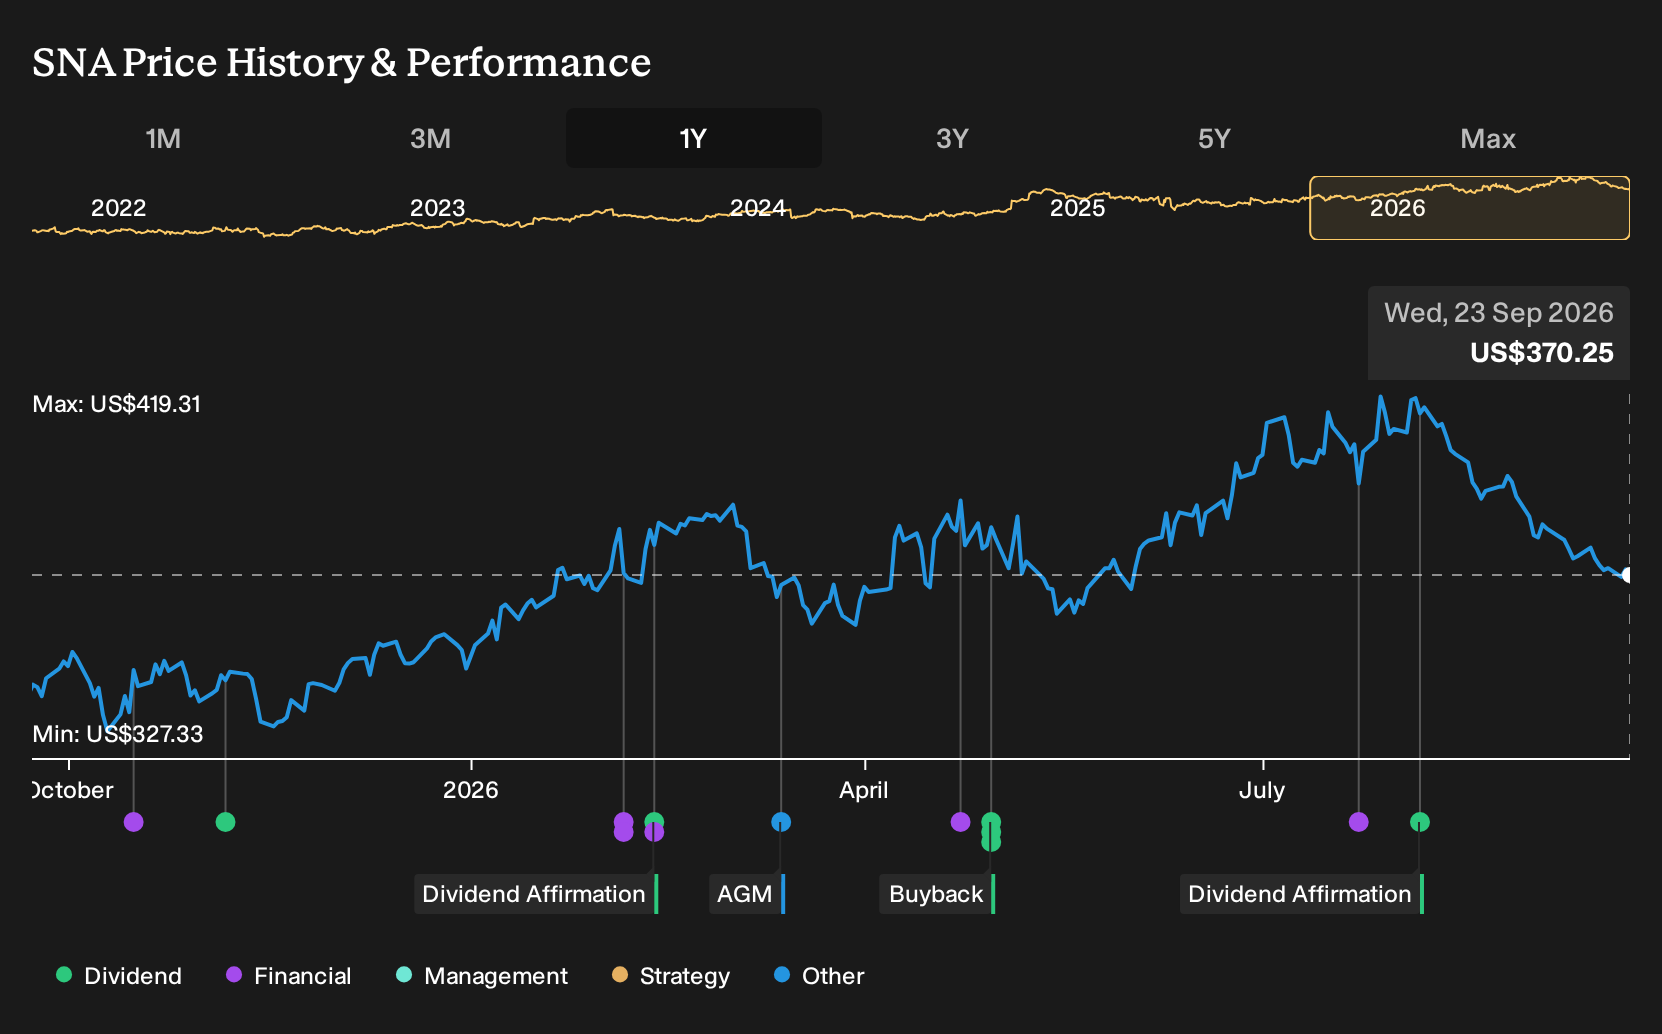
This matters because the main catalysts investors often watch, such as higher margin diagnostics adoption and recurring software style revenue, could be undermined if lower cost competitors squeeze pricing. The margin expansion signal provides some indication that Snap-on can absorb pressure while it promotes advanced platforms like TRITON. Execution risk remains, since slower organic growth and weaker share price momentum suggest that the market is still looking for clearer evidence of durable demand, not just cost improvements.
Snap-on's narrative projects US$5.6b revenue and US$1.3b earnings by 2029. This assumes 1.8% yearly revenue growth and an earnings increase of about US$300m from US$1.0b today.
Uncover how Snap-on's fair value indicates a 10% potential upside to its current price that could narrow quickly.
Exploring Other Perspectives
Some of the most optimistic analysts frame Snap-on less around margin risk and more around a possible demand surge. Before this RCI news, the bullish group was already penciling in revenue of about US$5.6b and earnings of roughly US$1.3b by 2029. That is a meaningfully brighter story. Use this surprise margin print as a cue to compare those forecasts with your own view and consider which narrative aligns more closely with how you see the next few years.
Explore 6 other Snap-on fair value estimates, including one that suggests as much as 31% upside from the current price!
The Verdict Is Yours
Don't just follow the ticker. Dig into the data and build a conviction that's truly your own.
- A great starting point for your Snap-on research is our analysis highlighting 5 key rewards that could impact your investment decision.
- See our latest analysis for Snap-on. The report includes a comprehensive fundamental analysis summarized in a single visual, the Snowflake, making it easy to evaluate Snap-on's overall financial health at a glance.
Looking For More Snap-on Style Ideas?
If Snap-on's focus on cash generation and efficiency has sharpened your appetite for deeper research, broaden the lens and scan other listed businesses through the Simply Wall St Screener. You can filter for quality, balance sheet strength and income potential in a few clicks, then compare those profiles with what you see in Snap-on today.
- For investors hunting for mispriced quality, review a curated 30 high quality undervalued stocks that match strong fundamentals with more modest valuations.
- If capital preservation and resilience matter most to you, narrow in on a 31 resilient stocks with low risk scores that score well on volatility and financial strength.
- When you want sturdier business models with clean finances, scan a list of solid balance sheet and fundamentals (23 results) where leverage is contained and liquidity looks more comfortable.
This article by Simply Wall St is general in nature. We provide commentary based on historical data and analyst forecasts only using an unbiased methodology and our articles are not intended to be financial advice. It does not constitute a recommendation to buy or sell any stock, and does not take account of your objectives, or your financial situation. We aim to bring you long-term focused analysis driven by fundamental data. Note that our analysis may not factor in the latest price-sensitive company announcements or qualitative material. Simply Wall St has no position in any stocks mentioned.
Have feedback on this article? Concerned about the content? Get in touch with us directly. Alternatively, email editorial-team@simplywallst.com