
- PRICING
- LIVE QUOTES
- LEARN
- HELP


EN
DENSO (TSE:6902), Why Is It Getting Attention Again?
DENSO (TSE:6902) has drawn investor attention after its recent share performance, with the stock down about 12% year to date and roughly 10% over the past year.
The recent 1 day share price return decline of 1.31% takes DENSO to ¥1,915, capping a year where shorter term momentum over 90 days has been positive at 2.93%, but longer term total shareholder returns over 3 years are still down 17.88%. This suggests sentiment has cooled over time despite occasional rallies.
Scan beyond DENSO's pullback and evaluate other auto suppliers with recent price pressure and solid fundamentals using our hand picked list of solid balance sheet and fundamentals (21 results) as a comparison set.
So is this share price slide telling you something new about DENSO's business, or just marking a shift in mood after a stronger five year run and recent earnings growth? And how does that line up with what you are paying today?
Preferred Multiple of 11.1x P/E: Is it justified?
DENSO currently trades on a P/E of 11.1x, which the SWS model flags as good value against both its own fair P/E level and peer averages, even after the recent share price slide to ¥1,915.
The P/E ratio compares what investors are paying for each unit of earnings, so it effectively reflects how the market is weighing DENSO's profit profile against other auto parts makers.
On one side, the stock is described as good value versus an estimated fair P/E of 13.5x and a peer average of 13.3x. This points to a clear discount that the market could re rate if sentiment improves.
At the same time, that gap sits alongside slower forecast earnings growth of 5.2% a year and low forecast return on equity of 8.6%. This may help explain why investors are not fully closing the valuation gap even with high quality earnings flagged.
Relative to the domestic auto components group, the picture is more mixed. DENSO's 11.1x P/E is described as expensive compared with the Japan Auto Components industry average of 9.8x, so the current tag prices the stock above the sector even though it screens as cheap against its own fair ratio and broad peer set.
Explore the SWS fair ratio for DENSO.
Result: Price-to-earnings of 11.1x (ABOUT RIGHT)
For investors who want to cross check this P/E view against a cash flow based lens, the SWS DCF model currently estimates a fair value of ¥3,762.22 for DENSO compared with the ¥1,915 market price. This implies the shares are trading 49.1% below that intrinsic value estimate.
The DCF framework takes projected future cash flows and discounts them back to today using a required rate of return. This helps translate long term profit expectations into a single present value number that can be compared directly with the live share price.
For DENSO, that model is being applied to a business that has grown earnings by 10.1% per year over the past 5 years, is forecast to grow profits 5.19% annually, and operates across Japan, Asia, North America and Europe. Any change in those assumptions or the discount rate would move the fair value output.
Look into how the SWS DCF model arrives at its fair value.
Result: DCF Fair value of ¥3,762.22 (UNDERVALUED)
Still, DENSO's exposure to global auto demand and its reliance on large Japanese and North American customers could quickly challenge this valuation story if order patterns weaken.
Find out about the key risks to this DENSO narrative.
Another View on DENSO's value
The earlier P/E work suggested DENSO looks reasonably priced. The SWS DCF model tells a stronger story, putting fair value at ¥3,762.22 against the current ¥1,915 share price, which implies the stock trades well below that cash flow based estimate. Which signal should carry more weight when you build your case?
Look into how the SWS DCF model arrives at its fair value.
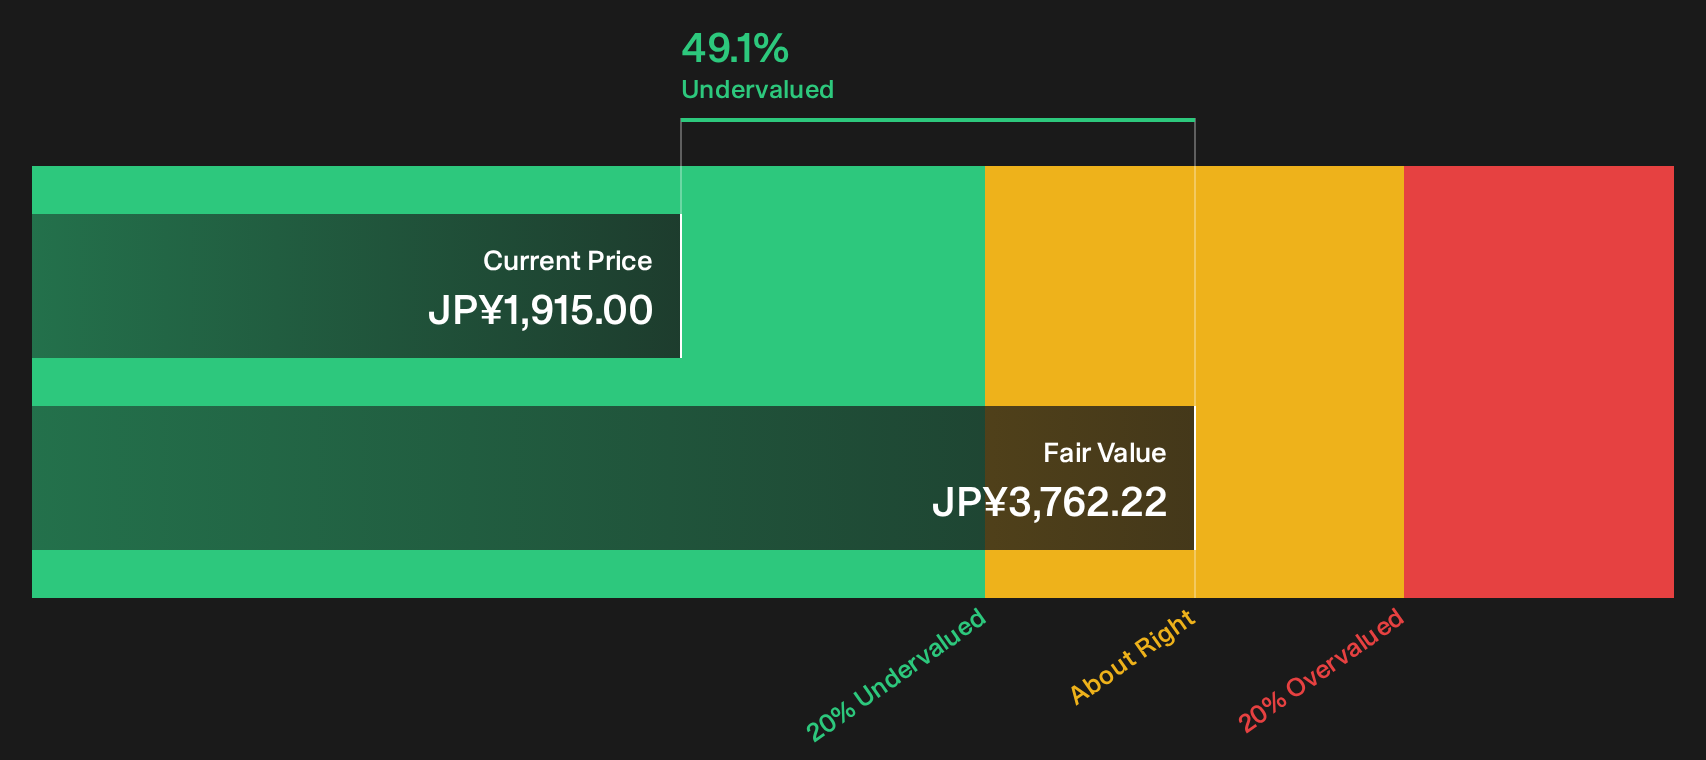
Simply Wall St performs a discounted cash flow (DCF) on every stock in the world every day (check out DENSO for example). We show the entire calculation in full. You can track the result in your watchlist or portfolio and be alerted when this changes, or use our stock screener to discover 17 high quality undervalued stocks. If you save a screener we even alert you when new companies match - so you never miss a potential opportunity.
Next Steps
Mixed signals around DENSO's valuation and outlook can pull investors in opposite directions, so consider reviewing the key data yourself and weighing both the caution and the upside by checking the full breakdown of 3 key rewards and 1 important warning sign.
Looking for more investment ideas beyond DENSO?
If DENSO has you thinking harder about price versus quality, you can put that momentum to work by scanning other opportunities with clear fundamentals and different risk profiles.
- Target potential mispricing by scanning companies that combine strong balance sheets with discounted valuations using the 17 high quality undervalued stocks.
- Explore the cash flow angle by reviewing stocks that pay higher yields and still aim to keep payouts supported by fundamentals through the 14 dividend fortresses.
- Limit downside first by focusing on businesses screened for resilience and lower overall risk scores via the 21 resilient stocks with low risk scores.
This article by Simply Wall St is general in nature. We provide commentary based on historical data and analyst forecasts only using an unbiased methodology and our articles are not intended to be financial advice. It does not constitute a recommendation to buy or sell any stock, and does not take account of your objectives, or your financial situation. We aim to bring you long-term focused analysis driven by fundamental data. Note that our analysis may not factor in the latest price-sensitive company announcements or qualitative material. Simply Wall St has no position in any stocks mentioned.
Have feedback on this article? Concerned about the content? Get in touch with us directly. Alternatively, email editorial-team@simplywallst.com