
- PRICING
- LIVE QUOTES
- LEARN
- HELP


EN
Is UGI (UGI) Undervalued As Rate Growth And RNG Plans Come Into Focus?
UGI (UGI) shares recently slipped about 1% to close near US$36.85, extending a decline over the past month while still showing a gain across the past three months and over the past year.
For UGI, the recent 1-day share price decline sits within a mixed pattern where short term momentum has faded, with the 7-day and 30-day share price returns both down, even as the 90-day share price return is positive and the 1-year total shareholder return of 16.45% points to a stronger longer run outcome that likely reflects changing views on both its risk profile and its future cash generation potential.
Compare UGI's mixed momentum with other potential opportunities by scanning our hand picked list of 29 high quality undervalued stocks that pair balance sheet strength with cash flow support.
So is UGI's recent slip a hint that expectations on the underlying utility and propane operations have cooled, or is sentiment simply resetting in line with the current valuation?
Most Popular Narrative: 11% Undervalued
UGI's widely followed fair value estimate of about $41.33 sits above the recent $36.85 close. This frames the recent pullback as a valuation gap rather than a collapse in expectations.
Anticipated implementation of new, higher utility rates in Pennsylvania, pending regulatory approval, will provide substantial incremental revenue beginning in fiscal 2026. This is expected to support continued investment in grid resiliency and modernization.
Strategic investments in renewable natural gas projects, bonus depreciation potential, and stronger regulatory incentives through recent legislation are expected to drive long-term EBITDA growth and improve net margins.
See why 33 investors see UGI as 11% undervalued.
Result: Fair Value of $41.33 (UNDERVALUED)
Still, the UGI story can change quickly if structural pressure on LPG demand deepens, or if rising infrastructure and regulatory costs squeeze the projected margin profile.
Find out about the key risks to this UGI narrative.
Another View On UGI Valuation
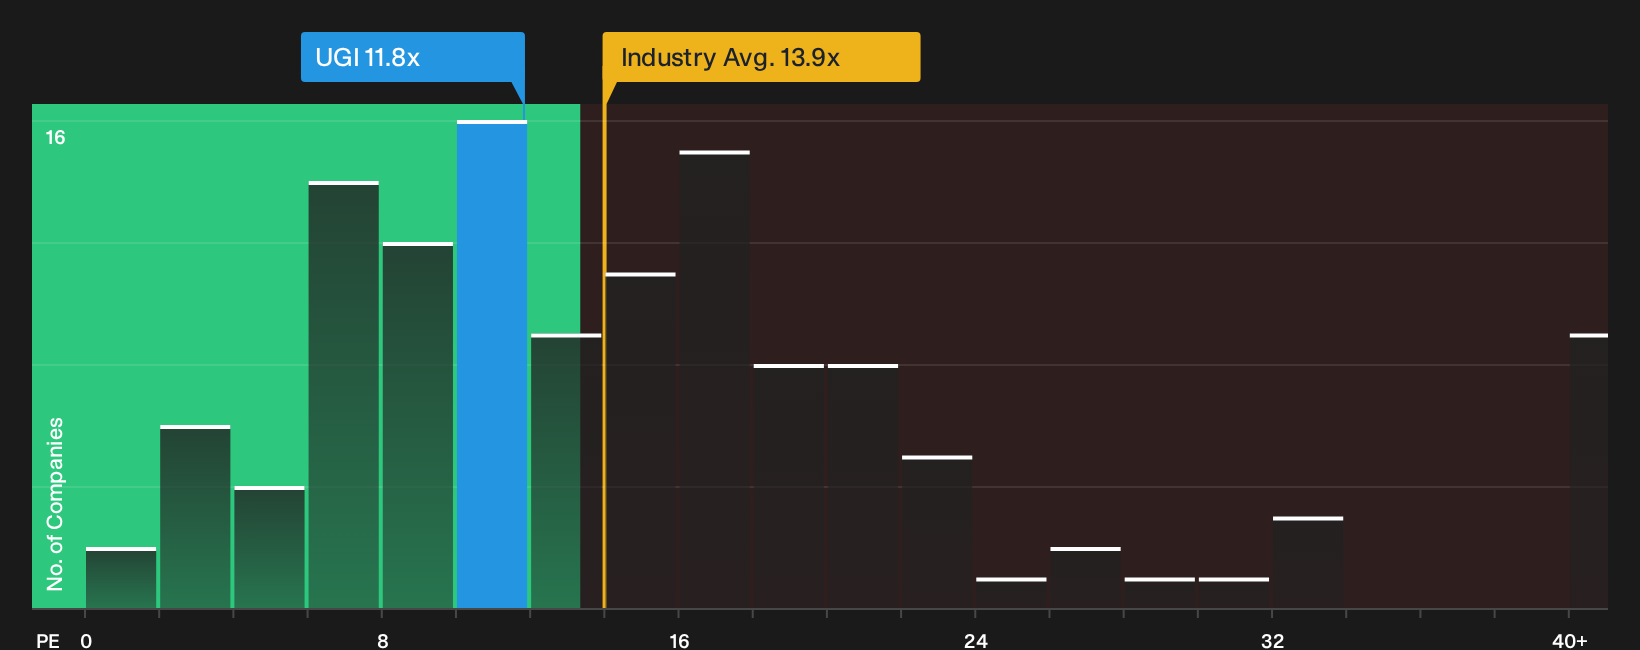
UGI screens as good value on earnings multiples, with a P/E of 11.8x versus an estimated fair ratio of 20.4x and peer and industry averages of 14.8x and 13.9x. That gap points to potential upside, but also raises a question: What is the market still worried about?
See what the numbers say about this price — find out in our valuation breakdown.
Simply Wall St performs a discounted cash flow (DCF) on every stock in the world every day (check out UGI for example). We show the entire calculation in full. You can track the result in your watchlist or portfolio and be alerted when this changes, or use our stock screener to discover 29 high quality undervalued stocks. If you save a screener we even alert you when new companies match - so you never miss a potential opportunity.
Next Steps
Sentiment around UGI is clearly split. Act while the data is fresh and test the thesis yourself using our breakdown of 4 key rewards and 2 important warning signs
Looking for more investment ideas beyond UGI?
If UGI has sharpened your focus on valuation and risk, do not stop here. Use carefully filtered screeners to uncover other potential candidates before the crowd does.
- Target resilient balance sheets and steady fundamentals by reviewing our list of solid balance sheet and fundamentals (23 results) that prioritises financial strength.
- Hunt for mispriced opportunities by checking the 16 high quality undiscovered gems that pair quality fundamentals with lower market attention.
- Focus on stability and capital preservation by scanning the 30 resilient stocks with low risk scores tailored for investors who care about controlled downside.
This article by Simply Wall St is general in nature. We provide commentary based on historical data and analyst forecasts only using an unbiased methodology and our articles are not intended to be financial advice. It does not constitute a recommendation to buy or sell any stock, and does not take account of your objectives, or your financial situation. We aim to bring you long-term focused analysis driven by fundamental data. Note that our analysis may not factor in the latest price-sensitive company announcements or qualitative material. Simply Wall St has no position in any stocks mentioned.
Have feedback on this article? Concerned about the content? Get in touch with us directly. Alternatively, email editorial-team@simplywallst.com