
- PRICING
- LIVE QUOTES
- LEARN
- HELP


EN
Brookfield Business (TSX:BBUC) Stock Looks Overvalued Even With Low Sales Pricing
Brookfield Business has delivered a strong 86.3% return over the past three years, which naturally puts the spotlight on whether the current share price around $36.84 still lines up with what the business generates in sales. With that kind of move in the rear-view mirror, the central issue for you today is how much revenue you are effectively paying for when you buy Brookfield Business stock.
- The 86.3% gain over three years means investors who held on have already seen substantial value creation. This raises the question of how much future sales power is now embedded in the valuation.
- The group relies on acquiring and operating businesses across different sectors. The quality, stability, and conversion of those acquired revenue streams into cash can shape how much investors are willing to pay for each dollar of sales.
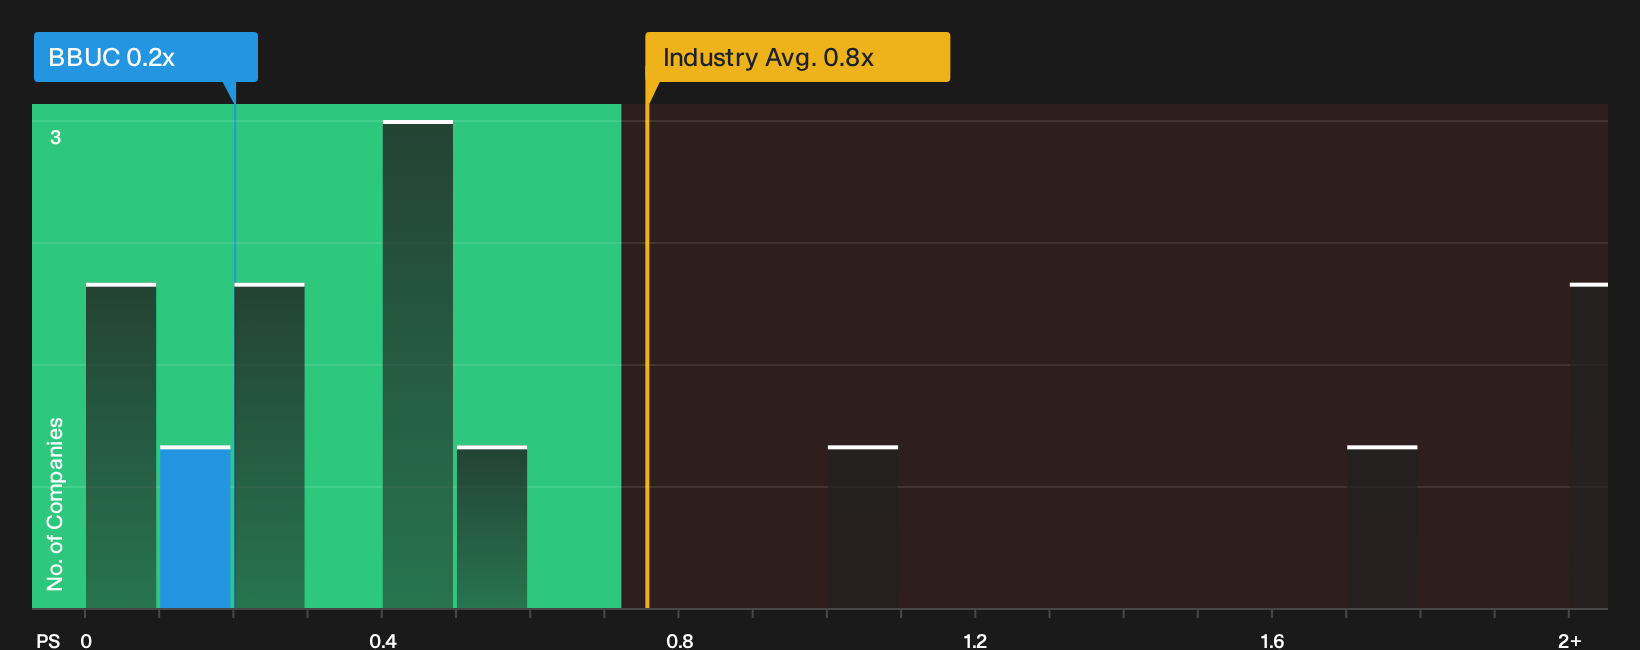
- Before you settle on a price for Brookfield Business, see what its peers cost. See how Brookfield Business's 0.2x P/S compares with its peers.
The issue now is whether Brookfield Business's current price is justified by its sales once you line it up against a Fair Ratio benchmark.
If you want to test this same sales based valuation question beyond Brookfield Business, it can help to compare with 7 high quality undervalued stocks.
Has Brookfield Business Run Too Far on Sales?
P/S fits Brookfield Business because revenue tends to be the cleanest common yardstick across its mix of acquired operations. On that measure, the stock trades at about 0.2x trailing sales, which is far below the industrials sector average P/S of roughly 0.8x and well under the peer group closer to 1.3x. For every CA$1 of Brookfield Business revenue, the market is only assigning a small fraction of the sales multiple that similar companies attract.
The Fair Ratio model, which blends the firm’s growth profile, margins, size and risk into a tailored benchmark, flags the current P/S as overvalued despite that low headline number. The framework is heavily penalising Brookfield Business for factors such as its risk profile and the quality of cash generation behind those revenues. As a result, the output is better read as a warning signal that this share price bakes in a rich assumption for each dollar of sales rather than a precise fair target. Explore the numbers behind Brookfield Business's P/S valuation.
The Brookfield Business Narrative: What Would Justify Today's Price?
Brookfield Business' Simply Wall St Narratives pick up where the P/S puzzle leaves off. They spell out the mix of future growth, profitability and earnings power that would need to hold for the stock to be worth significantly more or less than today’s price. They also show the underlying storyline that a single ratio or model figure quietly relies on, so you can watch whether that path is actually playing out on the Community page.
A clear, number driven narrative on Brookfield Business now gives you a reference point for where its growth, margins and execution would need to head for the current P/S to look either conservative or demanding over time. Putting those assumptions in writing creates a simple scorecard you can revisit as new results arrive, so you can see whether Brookfield Business' actual progress is lining up with the story you are using to justify the price.
Share your own Narrative for Brookfield Business and set out the assumptions behind your valuation.
Before you move on Brookfield Business, there is one more angle to check
Brookfield Business might look one way on a simple sales multiple, yet the research checks have flagged specific concerns that could change how you read that story once you see them in detail. Take a closer look at 2 warning signs (2 major) before settling on a valuation.
This article by Simply Wall St is general in nature. We provide commentary based on historical data and analyst forecasts only using an unbiased methodology and our articles are not intended to be financial advice. It does not constitute a recommendation to buy or sell any stock, and does not take account of your objectives, or your financial situation. We aim to bring you long-term focused analysis driven by fundamental data. Note that our analysis may not factor in the latest price-sensitive company announcements or qualitative material. Simply Wall St has no position in any stocks mentioned.
Have feedback on this article? Concerned about the content? Get in touch with us directly. Alternatively, email editorial-team@simplywallst.com