
- PRICING
- LIVE QUOTES
- LEARN
- HELP


EN
Grains 26/27 Spreads
Walsh Pure Grain Technicals / Daily News – Pure Hedge Division
Tim Healy 9/22/2026
If you would like to receive more information on the commodity markets or would like to open an account, please give me a call or click the link below.
Corn Futures Standard Spread (_S_SP_ZCZ6_ZCZ7)
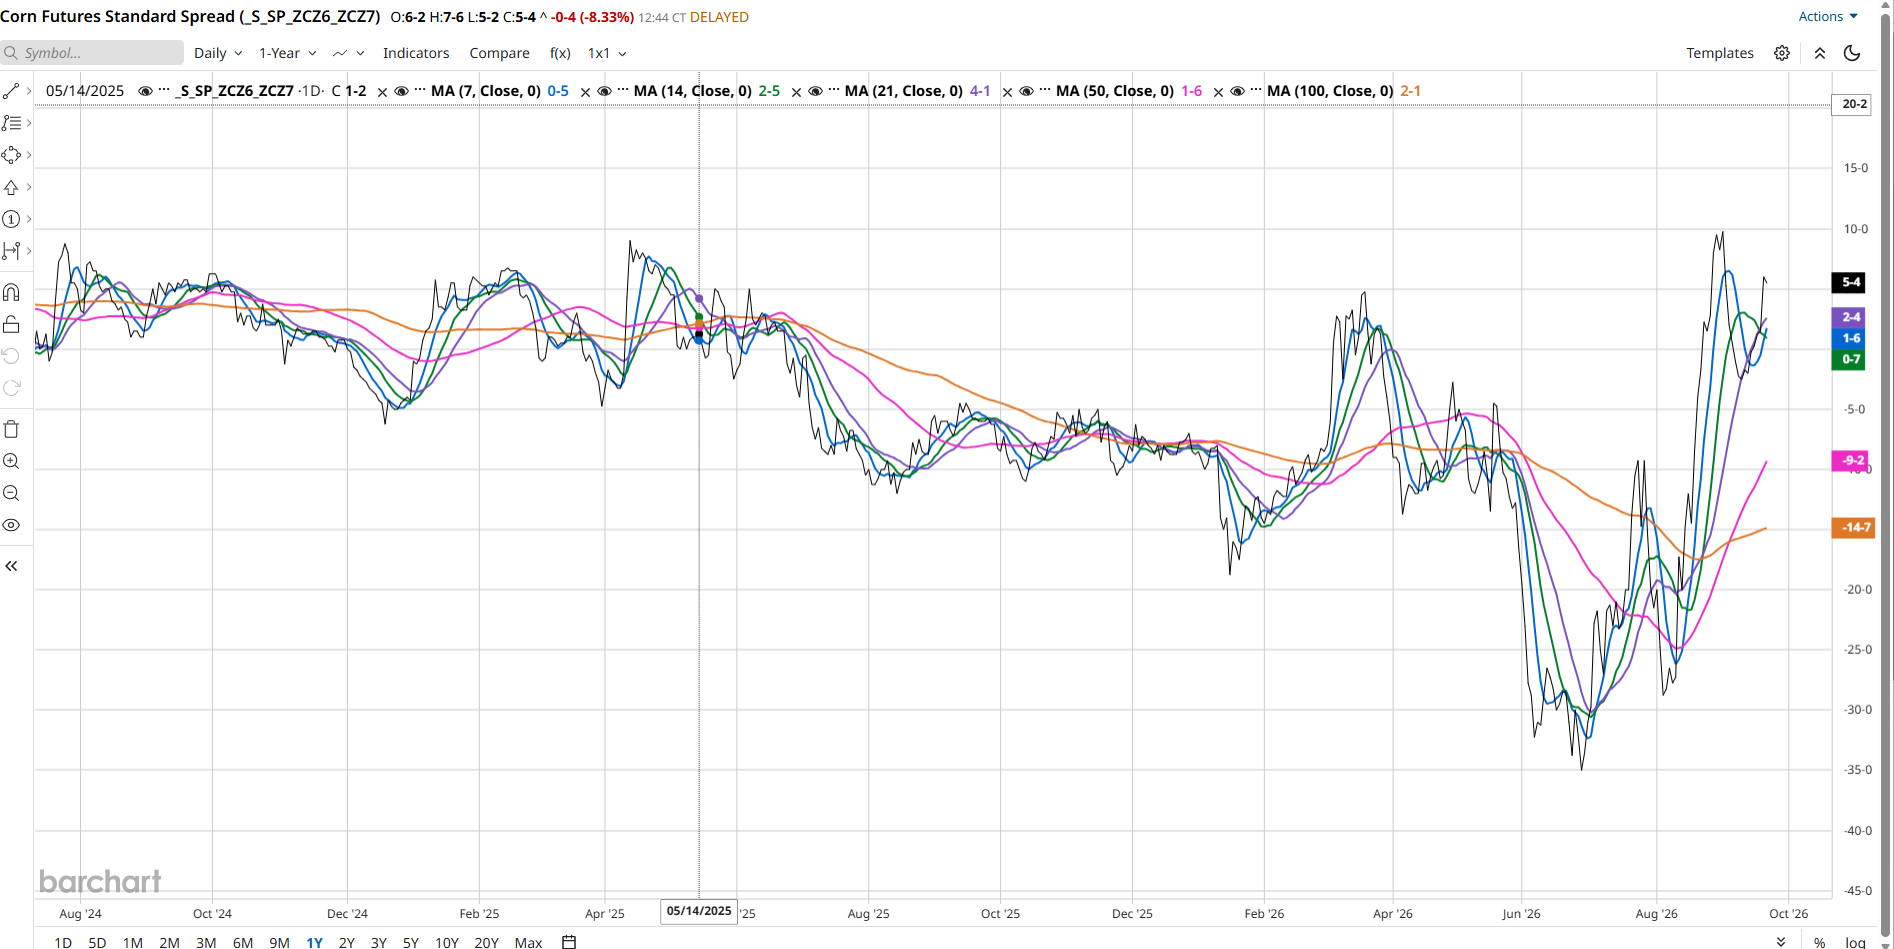
The spread is trading above every major moving average and latest price is 5.00. SMA (7) = 1.89, SMA (14) = 0.96, SMA (21) = 2.64.
This identifies a strong short-term uptrend. Some other notable averages, SMA (50) = -9.29 and the SMA (100) is -14.86. The spread has moved dramatically above its medium- and long-term averages, indicating a major trend shift
| Indicator | Value | Signal |
| Current Price | 5.00 | Bullish |
| 7-Day SMA | 1.89 | Price above MA → Bullish |
| 14-Day SMA | 0.96 | Bullish |
| 21-Day SMA | 2.64 | Bullish |
| 50-Day SMA | -9.29 | Strongly above trend |
| 100-Day SMA | -14.86 | Long-term trend reversal |
| RSI (7) | 76.08 | Overbought |
| RSI (14) | 66.46 | Bullish momentum |
| MACD | 3.46 | Positive trend |
| MACD Signal | 3.75 | MACD below signal |
| MACD Histogram | -0.30 | Momentum slowing |
RSI (14) = 66.46
Above 50 = bullish momentum and approaching 70 is becoming extended.
RSI (7) = 76.08
Above 70 = overbought
The market may need consolidation or a pullback before another major advance.
MACD Current readings: MACD = 3.46
Signal = 3.75
Histogram = -0.30
MACD remains above zero → bullish trend.
MACD has slipped below its signal line → near-term momentum slowing.
Watch for either: Bullish crossover (new push higher) or continued weakening (pullback risk).
Resistance 7.25 – 7.75, recent highs 10.75 – 11.75
Major historical resistance zone Support 5.25 – 6.00
Recent breakout level 2.00 – 2.65.
Moving-average support cluster 0.00
Psychological support Trend: Bullish
Momentum: Strong
RSI: Overbought Short-Term
MACD: Caution
Volatility: High. The spread is in a strong uptrend and has completed a significant bullish reversal relative to its long-term averages. The main caution is that the RSI is overbought and MACD momentum has started to flatten, which increases the odds of a short-term pause. A breakout above 7.75 would target the 10.75–11.75 area, while a drop below 5.25 would be the first warning that momentum is fading.
Soybean Futures Standard Spread (_S_SP_ZSX6_ZSX7)
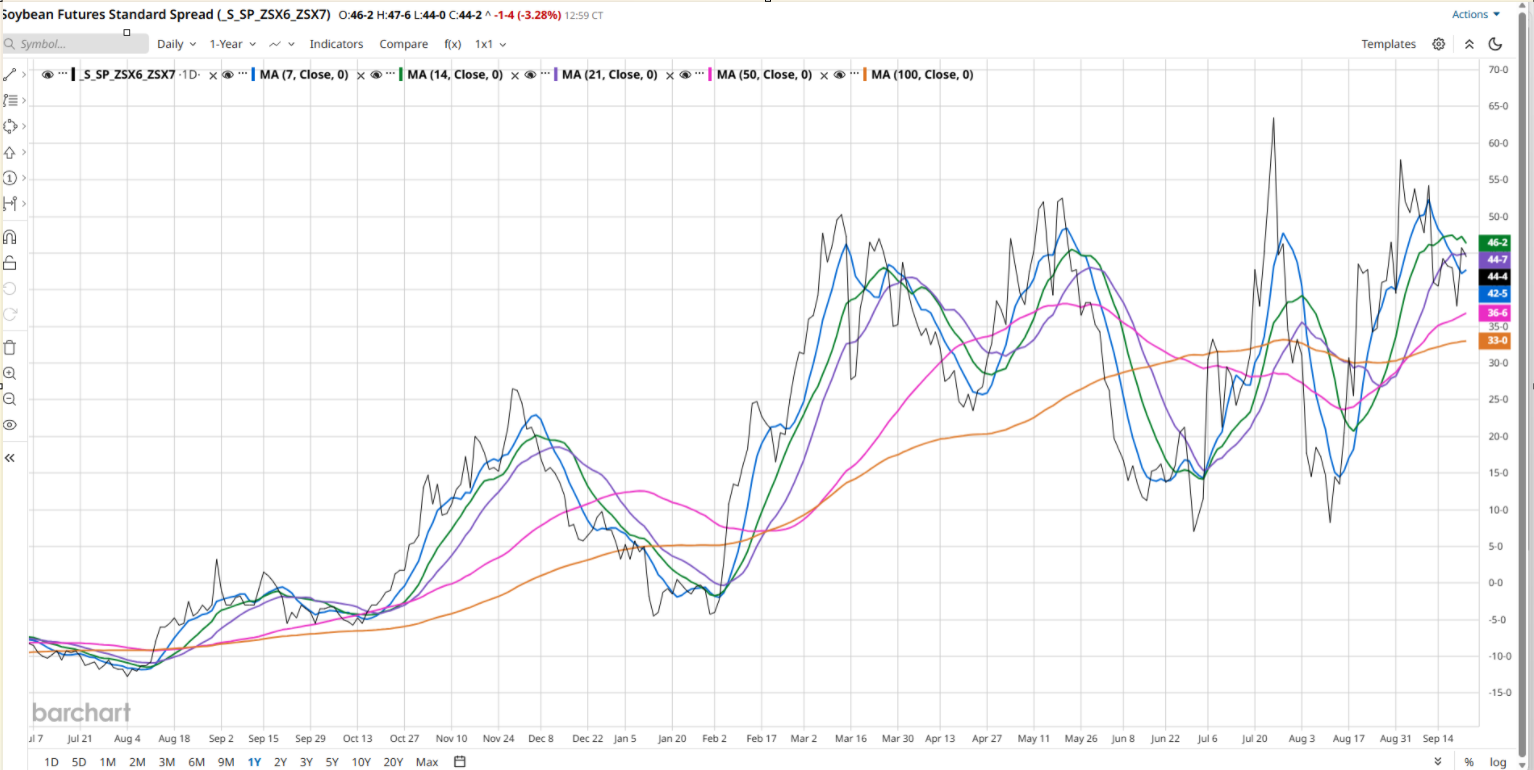
| Indicator | Moving average | Current vs. MA |
| 7-day | 43.00 | +3.50 |
| 14-day | 46.46 | +0.04 |
| 21-day | 45.02 | +1.48 |
| 50-day | 36.86 | +9.65 |
| 100-day | 32.98 | +13.52 |
Intermediate and long-term trend I believe is bullish. The current spread is above all five moving averages. The 50-day average is above the 100-day average, confirming a constructive longer-term structure. The 21-day average is also above the 50-day average, showing that intermediate momentum remains stronger than the longer-term baseline. Short-term trend is recovering but not fully aligned. The 7-day average at 43.00 remains below both the 14-day and 21-day averages. That configuration reflects the sharp early-September setback and means the short-term trend has not yet produced a fully bullish moving-average stack. However, the current value has recovered above the 7-, 14-, and 21-day averages. That is a positive near-term momentum signal. Immediate pivot: 14-day MA at 46.46, first support zone: 21-day MA at 45.02. Secondary support: 7-day MA at 43.00. Major trend support: 50-day MA at 36.86. Long-term baseline: 100-day MA at 32.98. Bottom line the spread has a bullish intermediate-to-long-term bias, while the short-term structure is still repairing. Holding above 45.02 to 46.46 would reinforce the recovery. A close back below 43.00 would weaken near-term momentum, although the broader trend would remain constructive while above the rising 50-day area near 36.86.
Wheat Futures Standard Spread (_S_SP_ZWZ6_ZWZ7)
Bullish Scenario (Spread Strengthens Toward Less Carry)
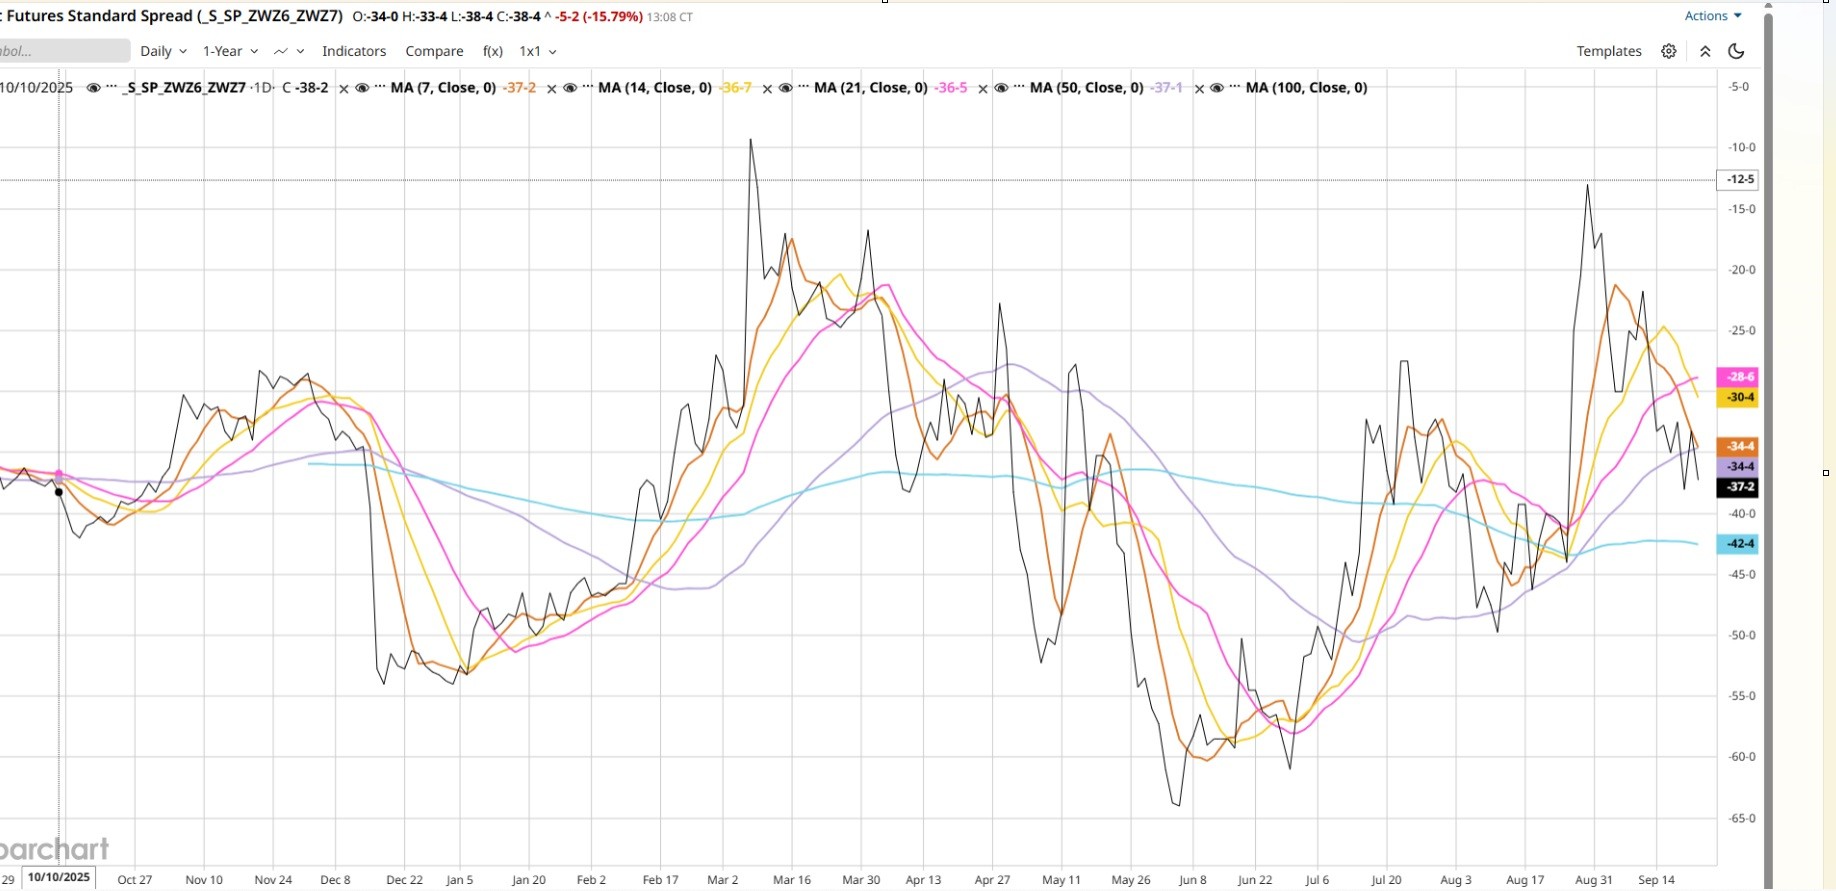
It would hold above the recent low area near-38.50 to -40.00. Recover back above-33.25 and then-30.00. Upside Objectives-33.25 (Sept. 21 level), -30.00 to -27.75 (early September resistance) and-25.00. Extended target-20.00 to -17.00 if nearby wheat demand improves or carry contracts. The spread spent most of June and July trading between approximately-50 and -60 cents, so today's-37.25 remains substantially stronger than summer values. Despite recent weakness, the larger trend since June has been toward a less bearish carry structure. Bulls want to see values stabilize above-40.00. A move through-33.25 would signal buyers are regaining control. Neutral Scenario (Consolidation) is if this spread trades sideways between-40.00 and -30.00 for several weeks. Expected Behavior would be the market digests the sharp September volatility and a range trading environment. Follow breakouts only after a close outside the range. I believe a bearish Scenario (Carry Expands Further).
Trigger is a Close below-40.00. Follow-through under-44.00 and August support levels. Downside Objectives-44.00,-46.25 to -47.75, -50.00.
Summer carry extreme near-58.00 to -61.00. September's decline from-17.00 on Sept. 1 to-37.25 currently shows renewed carry entering the structure. A failure of the spread to hold above the August breakout area would suggest that harvest pressure and ample supplies are dominating. A first trading bias could be a break below-40.00. Strong bearish confirmation: close below-44.00. Aggressively bearish if the spread returns below-50.00.
Wheat has deteriorated significantly during September, moving from-17.00 on Sept. 1 to-37.25.
The spread is approaching an important support zone around-38.50 to -40.00. A hold there could create a recovery rally toward-30.00, but a decisive break would open the door for a move toward-45 to -50.

Tim Healy
Broker
Pure Hedge Division
Direct: 1 312 957 4731
WALSH TRADING INC.
311 S. Wacker Suite 540
Chicago, Illinois 60606
Walsh Trading, Inc. is registered as a Guaranteed Introducing Broker with the Commodity Futures Trading Commission and an NFA Member.
Futures and options trading involves substantial risk and is not suitable for all investors. Therefore, individuals should carefully consider their financial condition in deciding whether to trade. Option traders should be aware that the exercise of a long option will result in a futures position. The valuation of futures and options may fluctuate, and as a result, clients may lose more than their original investment. The information contained on this site is the opinion of the writer or was obtained from sources cited within the commentary. The impact on market prices due to seasonal or market cycles and current news events may already be reflected in market prices. PAST PERFORMANCE IS NOT NECESSARILY INDICATIVE OF FUTURE RESULTS.
All information, communications, publications, and reports, including this specific material, used and distributed by Walsh Trading, Inc. (“WTI”) shall be construed as a solicitation for entering into a derivatives transaction. WTI does not distribute research reports, employ research analysts, or maintain a research department as defined in CFTC Regulation 1.71.