
- PRICING
- LIVE QUOTES
- LEARN
- HELP


EN
Why Has the U.S. Long Bond Futures Broken Out of the Multiyear Consolidation Range in 2026?
I concluded a July 21, 2026, Barchart article on the bond market and interest rates with the following thoughts:
I do not see the bonds or TLT breaking substantially below the low or above the high end of the trading range since late 2023 in 2026. However, there are likely trading opportunities on the horizon as the markets move within their respective ranges. Meanwhile, interest rates significantly impact raw material prices as they determine the costs of financing production and carrying inventories. Lower rates tend to support higher raw material prices, while high rates can put pressure on prices.
The U.S. government long bond futures were trading at 110-25 on July 20, with the TLT at $83.97 per share. In September 2026, the futures and TLT dropped below the low end of the multi-year consolidation period.
Long bond futures fall below support
The U.S. 30-year Treasury Bond Futures plunged from the March 2020 high of 191-22 to the October 2023 low of 107-04.
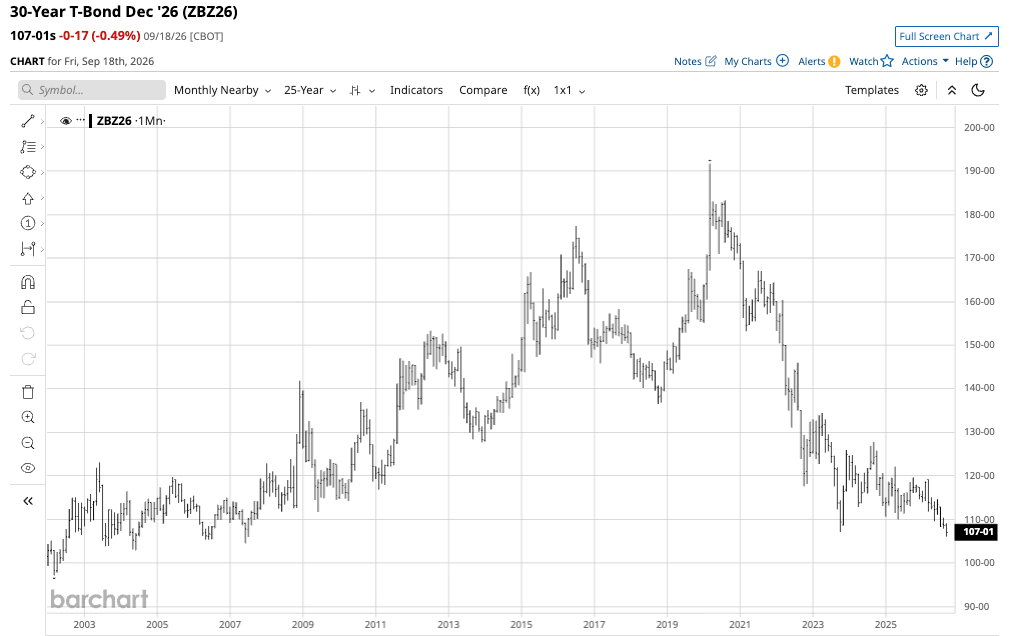
The monthly continuous contract chart shows long bond futures have fallen below the 2023 low, and the bearish trend of lower highs and lower lows remains intact. Bonds declined to a low of 106-01 in September 2026, the lowest level since July 2007.
The TLT ETF follows long bonds
Before the long-bond futures traded below the October 2023 low in September, the iShares 20+ Year Treasure Bond ETF (TLT) made a lower low in August 2026.
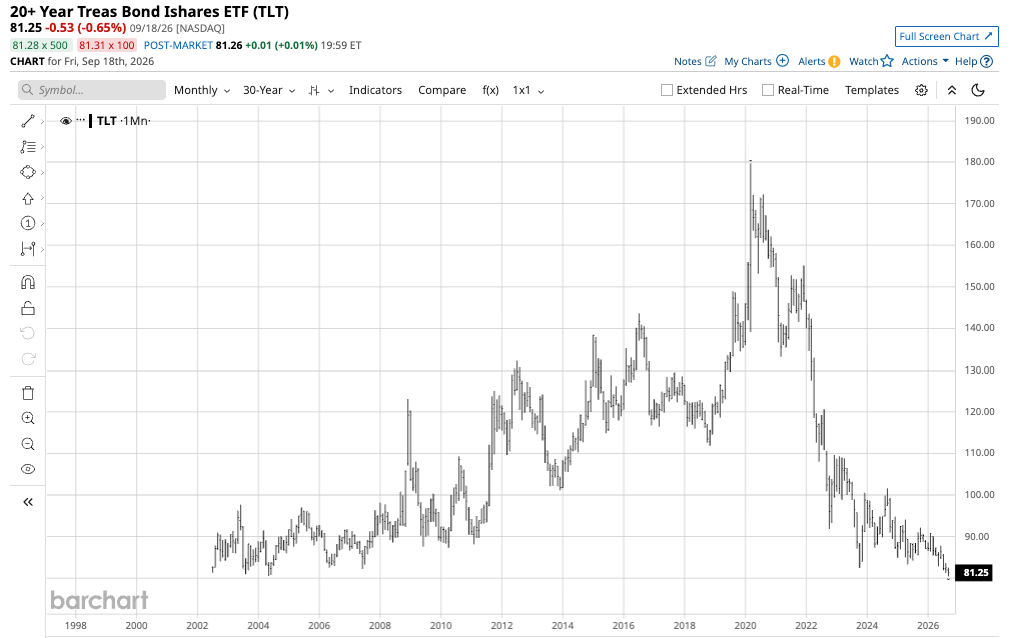
The monthly chart highlights the decline from the March 2020 high of $179.70 to the October 2023 low of $82.42 per share. In August 2026, TLT fell below the 2023 low to $81.17 per share; in September, it hit a lower low of $80.46, the lowest since TLT began trading in July 2002. At $81.25 on September 19, TLT remained in a bearish trend, not far above the most recent low.
U.S. debt continues to grow after reaching a new milestone in August
The U.S. debt has continued to grow by leaps and bounds and reached a milestone in August 2026.
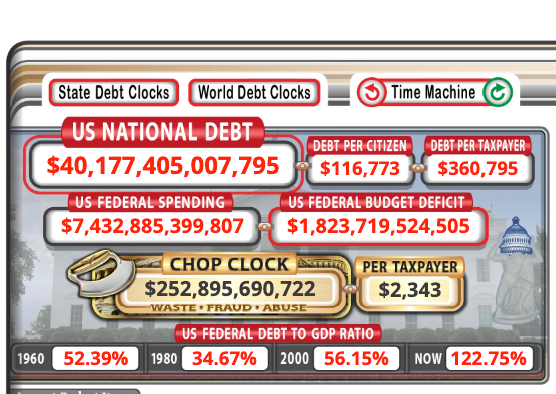
The chart shows that U.S. debt is now over $40 trillion, with the debt-to-GDP ratio of 122.75%. Spending continues to outstrip revenues, and the 3.875% Fed Funds Rate, after last week’s 25 basis point increase, means that financing the debt costs the U.S. over $1.55 trillion annually, increasing the debt even more.
The rising debt level puts upward pressure on interest rates and downward pressure on government bonds, as it erodes faith and credit in the U.S. government’s fiscal management.
Geopolitical uncertainty, the midterm elections, and stubborn inflation push bond yields higher
Beyond the mounting debt, a near-perfect storm of other events and factors is pushing government bond prices lower. Geopolitical uncertainty and increasing military spending requirements add to the debt and weigh on potential bond buyers. Moreover, sanctions and tariffs have caused many foreign U.S. government debt security buyers to limit or stop purchasing U.S. government bonds.
The bifurcation of the world’s nuclear powers, tariffs and sanctions, and Washington’s relations with friends and foes worldwide have caused a trend of de-dollarization. Countries are seeking alternative payment options for cross-border transactions. While the dollar remains the world’s reserve currency, gold’s ascent and continued central bank buying and repositioning of gold reserves signal a deterioration of faith in the U.S. dollar and U.S. government debt securities.
A legacy of the 2020 global pandemic and the unprecedented stimulus is elevated inflation. Wars between Russia and Ukraine and the U.S. and Iran have increased food and energy prices, only adding to inflationary pressures and eroding bond prices.
Meanwhile, uncertainty over the future of U.S. policy after the upcoming midterm elections is another factor weighing on U.S. government bond prices. Bonds do not react well to uncertainty as buyers seek safer investments. Over the past years, gold benefited from declining faith, rising from just over $250 per ounce in 1999 to its current level of over $4,400 per ounce. Gold has replaced the euro as the second-largest reserve asset by value, and further buying and price gains could push gold over the U.S. dollar as the ultimate reserve asset.
These factors have weighed on the bond market and TLT ETF, and there are few signs that the bearish price action will end anytime soon. However, surprises in the economic or geopolitical landscape that trigger a risk-off flight to quality have lifted U.S. government bonds in the past. This is perhaps the most bullish factor for the bearish market in September 2026.
Levels to watch in bonds and TLT over the coming weeks
Barring any shocking events, the current environment favors continued pressure on U.S. long bond futures.
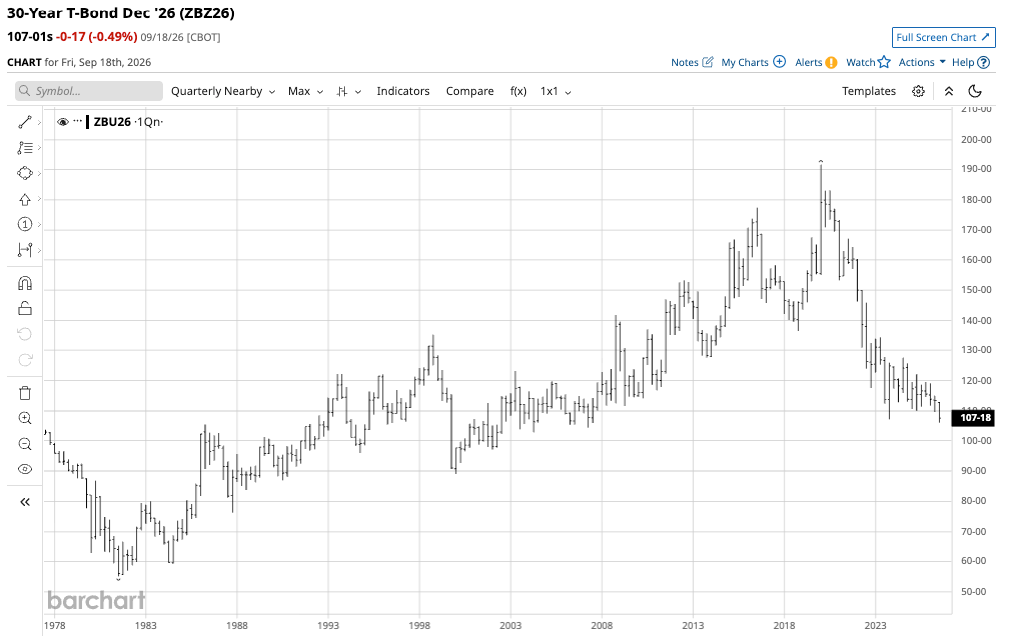
The long-term quarterly chart shows that while the first level of technical support is at the October 2023 low of 107-04 was broken, the 2007 low of 104-16 is the next bearish downside target. If bonds head significantly lower, the early 2000 low of 89-01 is a target, and the 1981 low of 55-05 was a bottom. Therefore, the bonds have significant downside potential.
Meanwhile, the critical technical resistance level that would negate the bearish trend since the 2020 high is the 2024 high of 127-22, well above the current level. The odds currently favor further declines.
TLT has traded since 2002, so it has a much shorter price history, but it follows long-bond futures.
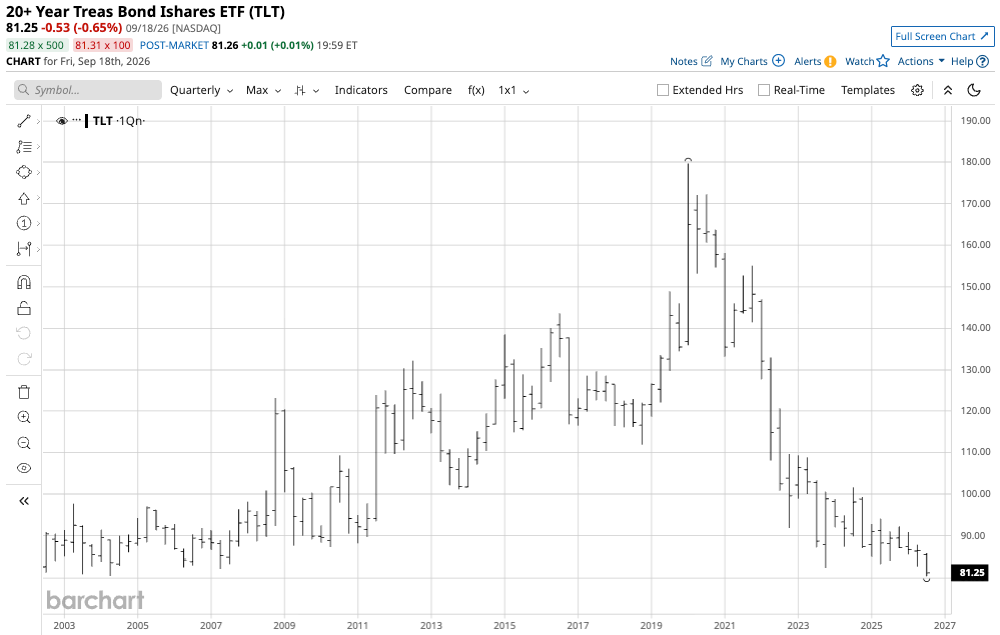
The quarterly chart shows that the recent decline below long-term technical support at the 2004 low of $80.51 per share drove TLT into uncharted territory. The decline below the 2004 bottom created a new all-time low in TLT in September 2026. Technical resistance is at the 2004 high of $101.64, which would negate the bearish trend since the 2020 high.
TLT is at a new low, and the long bond futures are at the lowest level in nearly two decades. The Fed has raised the Fed Funds rate at the September FOMC meeting and is forecasting additional rate hikes, with 8 committee members projecting a 4.38% rate in 2027. Debt, inflation, and uncertainty in the economic and geopolitical landscape have pushed interest rates to the highest level in years. In September 2026, the bearish trends in bonds and TLT continue, but if rising rates cause a risk-off period in markets, we could see bonds rally, as a flight to quality often supports gains in the bond market. Meanwhile, rising rates support the U.S. dollar, which is historically bearish for commodity prices. In 2026, historical trends may not hold.
On the date of publication, Andrew Hecht did not have (either directly or indirectly) positions in any of the securities mentioned in this article. All information and data in this article is solely for informational purposes. For more information please view the Barchart Disclosure Policy here.