
- PRICING
- LIVE QUOTES
- LEARN
- HELP


EN
Clariant (SWX:CLN), Why Is The Stock Getting Attention Today?
Clariant (SWX:CLN) is back in focus after its share price closed at CHF 10.57 on 19 September 2026, drawing attention to how the specialty chemicals group’s recent returns compare with its longer term record.
For context, Clariant’s share price return of 48.56% year to date and 42.26% over the past 90 days points to building momentum, even though the 5 year total shareholder return is down 29.17%, which keeps longer term holders under water.
Scan how Clariant’s sharp near term rebound compares with other potential turnaround ideas on our hand picked list of 616 high quality undiscovered gems, which pairs improving momentum with solid fundamentals.
Bulls see Clariant’s rebound and improving revenue and net income trends as signs of a genuine reset. Bears point to the recent loss and long term TSR drag. Which story does today’s valuation support?
Most Popular Narrative: 2% Overvalued
Clariant’s most followed narrative pegs fair value at CHF 10.41, just below the CHF 10.57 last close. The market is treating the recent rebound as almost fully priced in while still rewarding the improving earnings outlook.
Clariant's ongoing performance improvement and digitalization initiatives, such as the CLARITY platform in Catalysts and footprint optimization, are driving substantial cost savings and operational efficiencies. These measures are expected to deliver CHF 80 million annual savings by 2027 and aid in reaching a targeted 40% free cash flow conversion, boosting EBITDA margins and bottom line growth.
See why 12 investors see Clariant as 2% overvalued.
Result: Fair Value of CHF 10.41 (OVERVALUED)
Still, the recent Dow Europe damages claim and ongoing cost pressures linked to restructuring and compliance could yet upset the current Clariant narrative.
Find out about the key risks to this Clariant narrative.
Another View: Clariant Through The Sales Multiple Lens
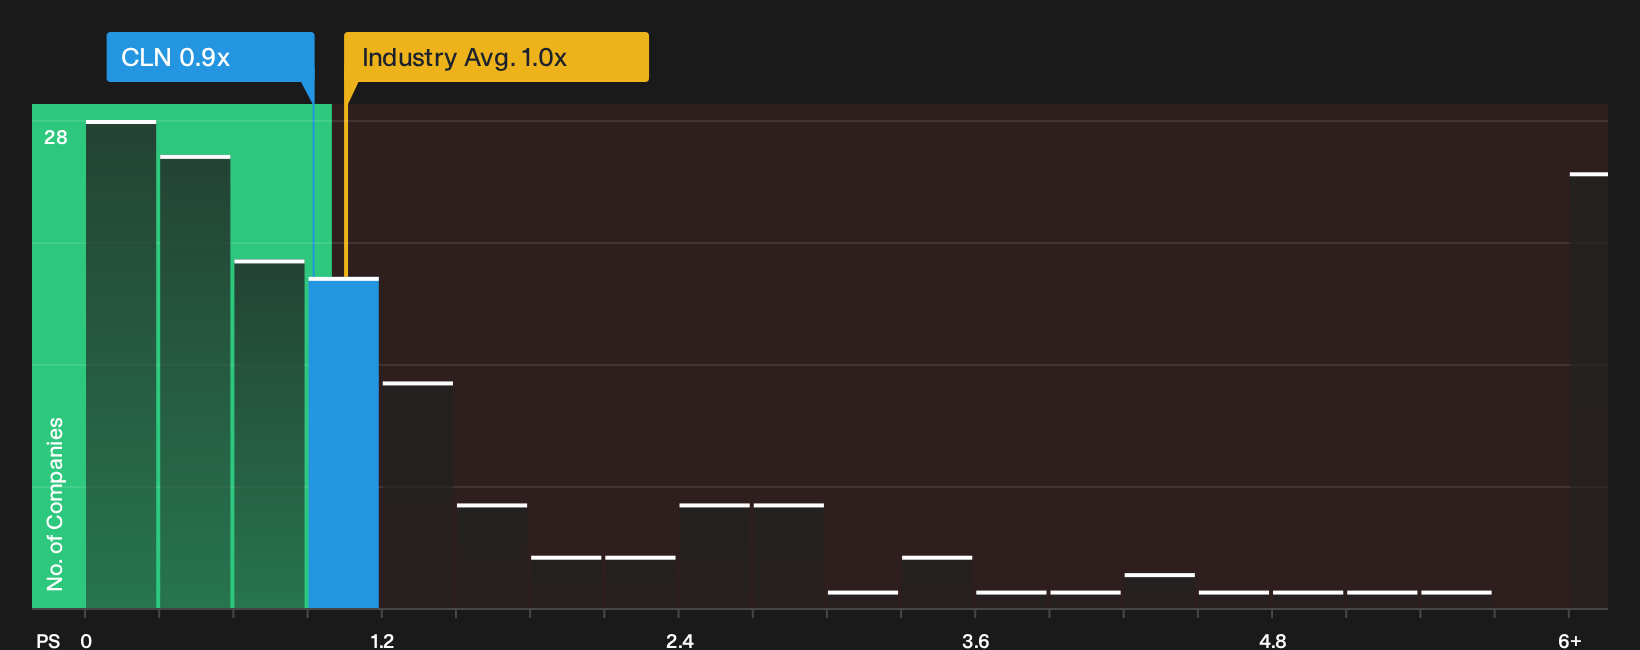
The SWS DCF model highlights a substantial mismatch between price and projected cash flows for Clariant, while the market is valuing the business on a modest P/S of 0.9x. That level sits below the European Chemicals industry at 1x and well under the peer average of 4.4x, and it also trails the fair ratio of 1.2x that the market could move towards. If sentiment keeps shifting, this discount could reflect valuation risk or potential room for the share price to narrow the gap over time.
See what the numbers say about this price — find out in our valuation breakdown.
Next Steps
Mixed signals around Clariant’s rebound and long term drag only matter if you put them in context. Act quickly and weigh both sides by reviewing the 3 key rewards and 3 important warning signs.
Ready for more ideas beyond Clariant?
If you only stop at Clariant, you risk missing other opportunities that fit your style and timeframe, so widen your search before the market moves.
- Target quality at a discount by scanning 178 high quality undervalued stocks that pair strong fundamentals with prices that do not fully reflect their financial profile.
- Prioritise resilience and sleep better at night by focusing on 229 resilient stocks with low risk scores that score well on financial strength and business stability.
- Strengthen your core holdings by using our list of solid balance sheet and fundamentals (198 results) to surface businesses with robust finances that can better handle shocks.
This article by Simply Wall St is general in nature. We provide commentary based on historical data and analyst forecasts only using an unbiased methodology and our articles are not intended to be financial advice. It does not constitute a recommendation to buy or sell any stock, and does not take account of your objectives, or your financial situation. We aim to bring you long-term focused analysis driven by fundamental data. Note that our analysis may not factor in the latest price-sensitive company announcements or qualitative material. Simply Wall St has no position in any stocks mentioned.
Have feedback on this article? Concerned about the content? Get in touch with us directly. Alternatively, email editorial-team@simplywallst.com