
- PRICING
- LIVE QUOTES
- LEARN
- HELP


EN
Why Mettler-Toledo International (MTD) Stock Climbed And What Investors Are Weighing Now
Mettler-Toledo International (MTD) recently drew attention after its share price closed at US$1,430.44. The stock’s move has investors reassessing how recent returns and business results compare with this valuation.
Recent trading has been brisk, with a 2.74% 1-day share price return and 11.25% 7-day share price return suggesting fresh interest in Mettler-Toledo International. A 23.67% 90-day share price return contrasts with a more moderate 13.70% 1-year total shareholder return as earlier gains have cooled.
Scan how Mettler-Toledo International compares with other potential movers by reviewing a hand picked set of list of solid balance sheet and fundamentals (23 results) in the same session.
Mettler-Toledo International has sprinted higher in a short window, which leaves a practical fork in the road. Do you lean into the current price, or wait and hope for a cheaper entry that may not appear?
Price-to-Earnings of 31.6x: Is it justified?
On current figures, Mettler-Toledo International trades at a P/E of 31.6x, which sits below several Life Sciences reference points yet still embeds a premium earnings tag at a $1,430.44 share price.
The P/E ratio compares what the market is willing to pay today for each dollar of current profit. For a business supplying precision instruments and software into pharma, biotech, food, and industrial customers, that lens focuses directly on how investors weigh earnings power against measured growth expectations.
Here, Mettler-Toledo International screens as good value against peers. Its 31.6x P/E is lower than a 38.2x peer average and a 37.8x Global Life Sciences benchmark. At the same time, the current valuation looks rich against an estimated fair P/E of 22.2x, which is a level the market could move toward if sentiment softens around its growth profile or its high level of debt becomes a bigger concern.
Against the wider Life Sciences industry average of 42.2x, the 31.6x P/E places Mettler-Toledo International at a clear discount that suggests investors are applying a tighter filter than they do to many sector peers.
Explore the SWS fair ratio for Mettler-Toledo International.
Result: Price-to-Earnings of 31.6x (ABOUT RIGHT)
Still, the story around Mettler-Toledo International can shift quickly if growth in its key lab and industrial markets slows, or if its debt profile starts to worry investors.
Find out about the key risks to this Mettler-Toledo International narrative.
Another View on Mettler-Toledo International’s Value
The P/E story is only one angle. Our DCF model values Mettler-Toledo International’s future cash flows at about $1,392.20 per share, which sits slightly below the current $1,430.44 price. That points to a modest premium. Is the gap a warning sign, or simply the cost of quality?
Look into how the SWS DCF model arrives at its fair value.
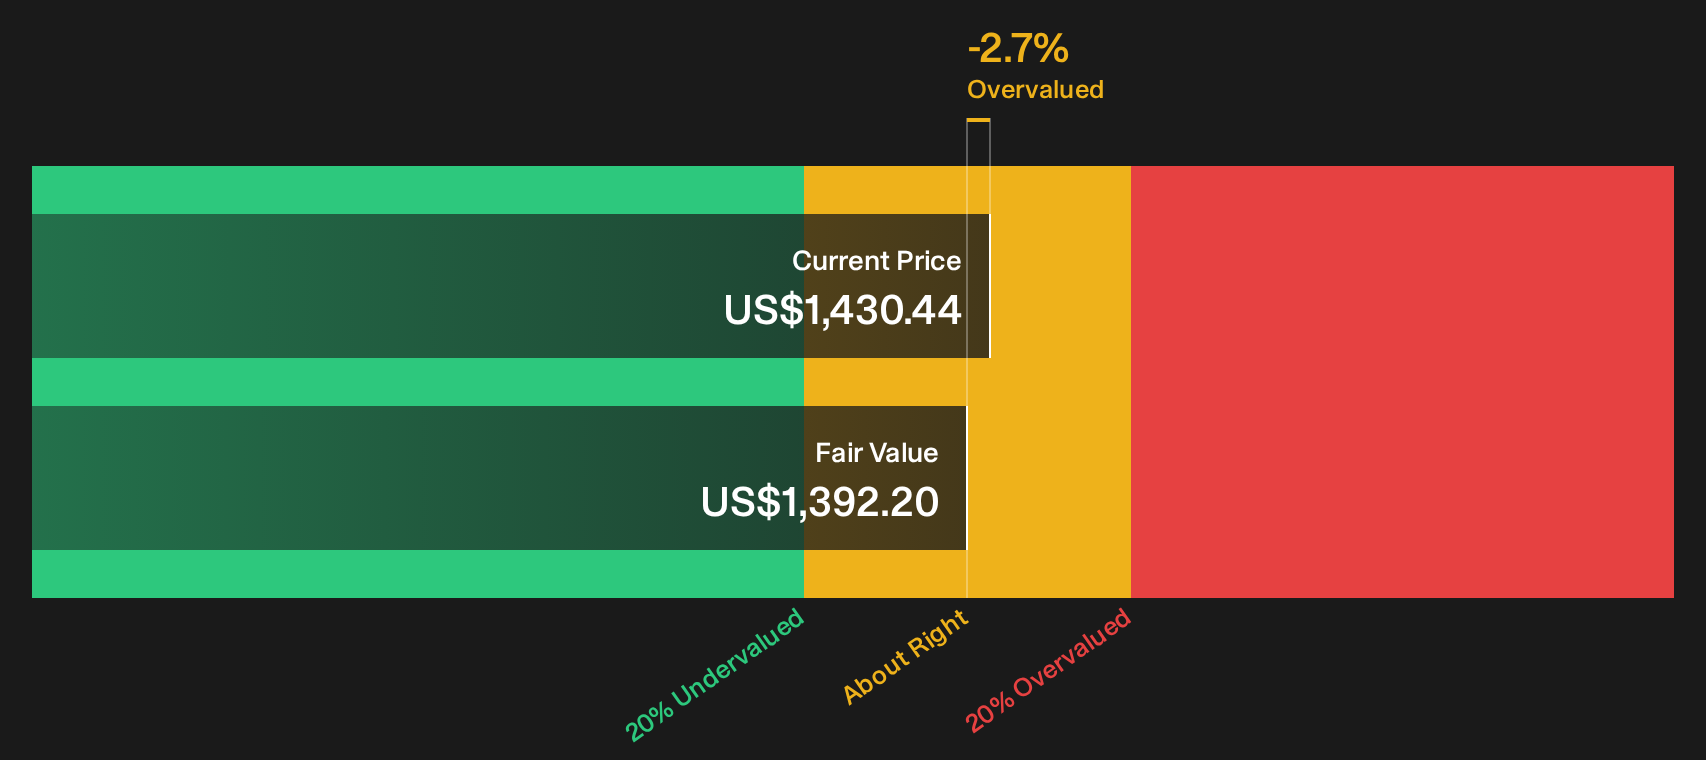
Simply Wall St performs a discounted cash flow (DCF) on every stock in the world every day (check out Mettler-Toledo International for example). We show the entire calculation in full. You can track the result in your watchlist or portfolio and be alerted when this changes, or use our stock screener to discover 30 high quality undervalued stocks. If you save a screener we even alert you when new companies match - so you never miss a potential opportunity.
Next Steps
Mixed signals around Mettler-Toledo International’s valuation and risk profile make this a good moment to move from reading to testing the numbers yourself. Take a closer look at the 3 key rewards and 1 important warning sign.
Looking for more investment ideas beyond Mettler-Toledo International?
If you stop with Mettler-Toledo International, you only see part of the opportunity set. Widen your view and let fresh ideas challenge your watchlist.
- Target stronger balance sheet resilience by scanning a list of solid balance sheet and fundamentals (23 results) that can handle tougher conditions without stretching finances.
- Hunt for quality at a discount through a focused 30 high quality undervalued stocks that highlights businesses priced below what their fundamentals suggest.
- Build a steadier income stream by reviewing 7 dividend fortresses that combine higher yields with robust underlying fundamentals.
This article by Simply Wall St is general in nature. We provide commentary based on historical data and analyst forecasts only using an unbiased methodology and our articles are not intended to be financial advice. It does not constitute a recommendation to buy or sell any stock, and does not take account of your objectives, or your financial situation. We aim to bring you long-term focused analysis driven by fundamental data. Note that our analysis may not factor in the latest price-sensitive company announcements or qualitative material. Simply Wall St has no position in any stocks mentioned.
Have feedback on this article? Concerned about the content? Get in touch with us directly. Alternatively, email editorial-team@simplywallst.com