
- PRICING
- LIVE QUOTES
- LEARN
- HELP


EN
Y.H. Dimri Construction & Development (TASE:DIMRI) After FTSE Index Entry Looks Pricey
Y.H. Dimri Construction & Development (TASE:DIMRI) was recently added to the FTSE All-World Index, a move that can attract more attention from institutional buyers and passive index trackers.
The index inclusion comes after a strong run in the 90-day share price, with a 10.75% share price return. The 1-year total shareholder return of 11.16% and 3-year total shareholder return of 61.77% suggest momentum in Y.H. Dimri Construction & Development has been building rather than fading.
Scan how Y.H. Dimri Construction & Development’s index inclusion compares with other potential breakouts by reviewing our hand picked 616 high quality undiscovered gems in similar market sweet spots.
Y.H. Dimri Construction & Development has clear scale and a broad project portfolio, and the index addition has put a spotlight on it. The key question is whether that quality is already fully reflected in the current price.
Price-to-Earnings of 24x: Is It Justified for Y.H. Dimri Construction & Development?
Y.H. Dimri Construction & Development trades on a P/E of 24x, which sits well above both its Israeli real estate peer group and the broader industry, even after the recent index inclusion tailwind and the last close at ₪370.9.
The P/E ratio compares the current share price with earnings per share. For a residential development business with exposure to Israel, Romania, and the Czech Republic, this metric helps you gauge how much investors are paying for each unit of profit, relative to other property developers and managers in the same market.
- Compared with the IL Real Estate industry average P/E of 13.4x, Y.H. Dimri Construction & Development screens as expensive.
- Against a peer average P/E of 9.1x, the stock carries an even steeper premium.
- Earnings quality is described as high, yet recent profitability has been under pressure, with earnings contracting 38.9% over the past year and net profit margins of 19.4% now below last year’s 28%.
- Return on equity sits at 8.2%, which is flagged as low compared with a 20% threshold often used as a high bar for efficiency.
- On top of this, the SWS DCF model estimates a future cash flow value of ₪110.3 per share, while the current price is ₪370.9, which suggests the market price is well above that cash flow based reference point.
When a property developer trades at a premium P/E multiple, investors are effectively paying up for the earnings stream. In this case, the gap between 24x and both the 13.4x industry average and the 9.1x peer group is wide, which points to a market that is assigning a rich tag to the profits of Y.H. Dimri Construction & Development despite lower recent margins, a low return on equity, and a dividend of 2.4% that is flagged as not being well covered by free cash flow.
Result: Price-to-Earnings of 24x (OVERVALUED)
See what the numbers say about this price — find out in our valuation breakdown.
Still, Y.H. Dimri Construction & Development faces clear risks if earnings keep contracting or if cash flow remains too tight to comfortably cover the dividend.
Find out about the key risks to this Y.H. Dimri Construction & Development narrative.
Another View On Y.H. Dimri Construction & Development’s Value
There is a very different message coming from the SWS DCF model. On this view, Y.H. Dimri Construction & Development’s estimated future cash flow value is ₪110.3 per share, while the stock trades at ₪370.9. That points to a valuation that screens as expensive. So which compass do you trust when both earnings multiples and cash flows are indicating rich pricing?
Look into how the SWS DCF model arrives at its fair value.
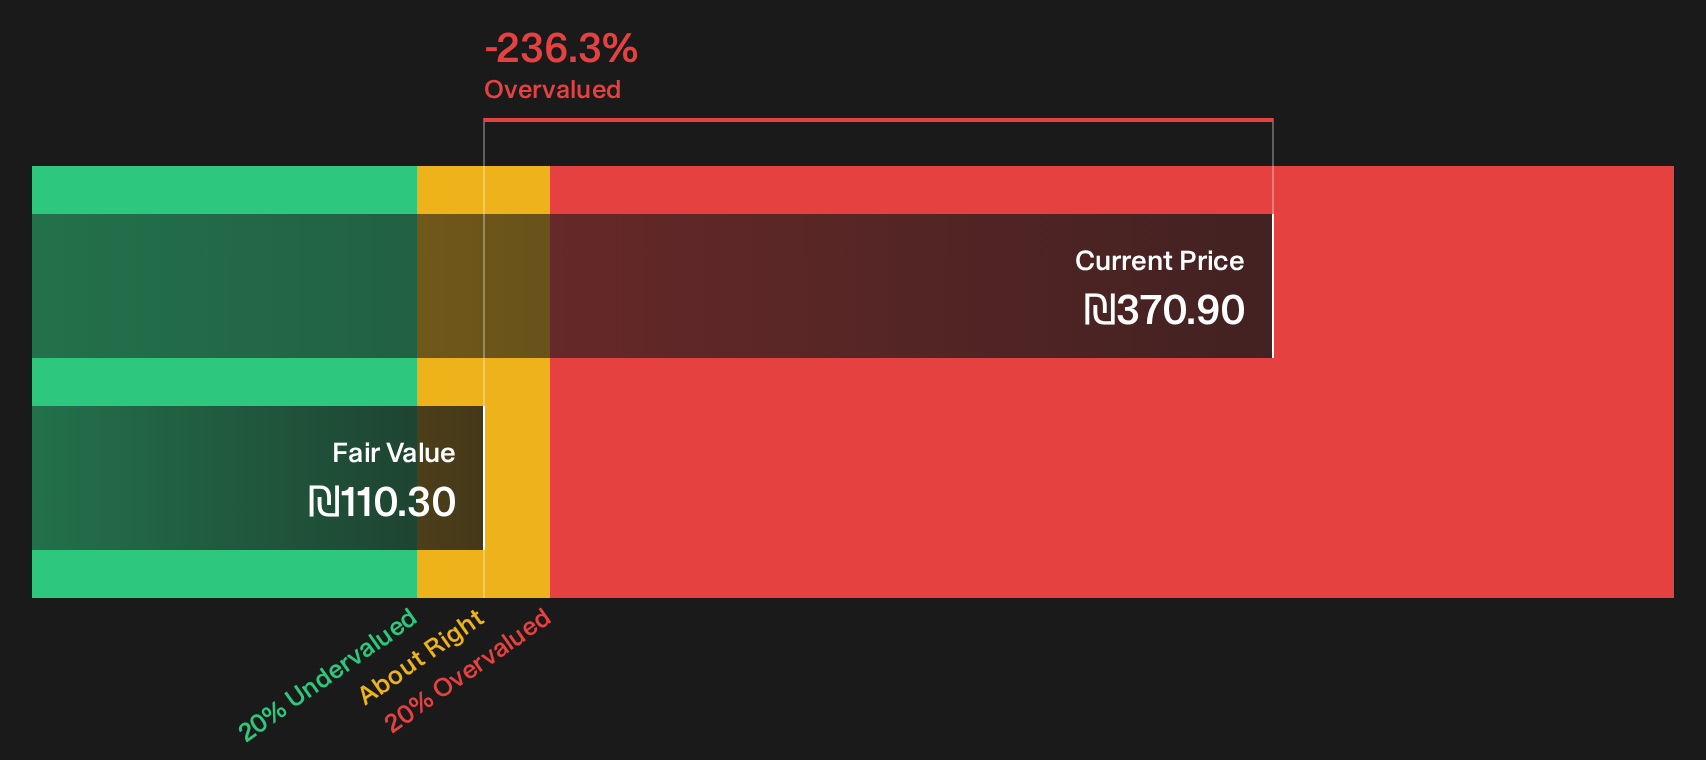
Simply Wall St performs a discounted cash flow (DCF) on every stock in the world every day (check out Y.H. Dimri Construction & Development for example). We show the entire calculation in full. You can track the result in your watchlist or portfolio and be alerted when this changes, or use our stock screener to discover 174 high quality undervalued stocks. If you save a screener we even alert you when new companies match - so you never miss a potential opportunity.
Next Steps
Concerned this read on Y.H. Dimri Construction & Development skews too cautious or too optimistic? Move quickly to review the underlying figures yourself, and then weigh them against the 3 important warning signs.
Looking for more investment ideas beyond Y.H. Dimri Construction & Development?
Once you have a view on Y.H. Dimri Construction & Development, it makes sense to scan a wider field of opportunities that might better match your risk and return preferences.
- Target potential value opportunities by reviewing companies that score well on quality and pricing using the 174 high quality undervalued stocks.
- Strengthen the defensive side of your portfolio by focusing on businesses with robust finances through the list of solid balance sheet and fundamentals (198 results).
- Build a stream of income-focused ideas by filtering for reliable payers with the 161 dividend fortresses.
This article by Simply Wall St is general in nature. We provide commentary based on historical data and analyst forecasts only using an unbiased methodology and our articles are not intended to be financial advice. It does not constitute a recommendation to buy or sell any stock, and does not take account of your objectives, or your financial situation. We aim to bring you long-term focused analysis driven by fundamental data. Note that our analysis may not factor in the latest price-sensitive company announcements or qualitative material. Simply Wall St has no position in any stocks mentioned.
Have feedback on this article? Concerned about the content? Get in touch with us directly. Alternatively, email editorial-team@simplywallst.com