
- PRICING
- LIVE QUOTES
- LEARN
- HELP


EN
Is Yue Yuen Industrial (Holdings) (SEHK:551) Cheap Following Its Latest Revenue Update?
Yue Yuen Industrial (Holdings) (SEHK:551) has reported unaudited figures for August, with net consolidated operating revenue of US$636.647m for the month and US$5.217b for the year to date.
The latest revenue update lands as Yue Yuen Industrial (Holdings) trades at HK$12.4, with the share price down 10.6% over the past 30 days and 22.35% year to date, even though the 3 year total shareholder return of 78.57% points to a much stronger longer run outcome than the recent pullback suggests.
Compare Yue Yuen Industrial (Holdings)'s recent pullback and revenue snapshot with a curated group of peers using our 179 high quality undervalued stocks, which combines cash generation with balance sheet strength.
Yue Yuen Industrial (Holdings) has reported new revenue data while the share price has retreated sharply. Is this the moment to step in, or does the recent slide argue for patience until the valuation case is clearer?
Preferred P/E of 9x for Yue Yuen Industrial (Holdings): Is it justified?
On Simply Wall St's numbers, Yue Yuen Industrial (Holdings) trades on a P/E of 9x, which screens as more expensive than both its peer group on 7.4x and the Hong Kong Luxury industry on 8.1x, even though it is described as good value relative to an estimated fair P/E of 9.5x.
The P/E ratio compares the share price with earnings per share, so it reflects how much investors are paying today for each unit of current profit. For a manufacturer and retailer of sports and leisure footwear like Yue Yuen Industrial (Holdings), that lens is particularly relevant because profit swings and margin pressure can quickly change how that multiple looks.
Here the picture is mixed. The stock carries a richer P/E than both direct peers and the broader Luxury sector, which suggests the market is willing to pay more for each dollar of Yue Yuen Industrial (Holdings)'s earnings than it pays for rivals. At the same time, Simply Wall St's fair P/E estimate of 9.5x sits a little above the current 9x level, which signals limited re-rating scope if the market leans toward that reference point.
Relative to the Hong Kong Luxury industry average P/E of 8.1x, Yue Yuen Industrial (Holdings)'s 9x multiple is meaningfully higher, which points to investors pricing in stronger quality, resilience or earnings potential than the sector overall.
Explore the SWS fair ratio for Yue Yuen Industrial (Holdings).
Result: Price-to-earnings of 9x (OVERVALUED) compared to peers.
Still, Yue Yuen Industrial (Holdings) faces real pressure if demand from key brand customers softens or if margin strain in its manufacturing and retailing units persists.
Find out about the key risks to this Yue Yuen Industrial (Holdings) narrative.
Another view on Yue Yuen Industrial (Holdings) using cash flows
The earlier P/E check painted Yue Yuen Industrial (Holdings) as expensive against peers, yet our DCF model points the other way. With the stock at HK$12.4 and the SWS DCF value at HK$29.62, the cash flow lens suggests the shares are materially undervalued. Which signal should carry more weight for you right now?
Look into how the SWS DCF model arrives at its fair value.
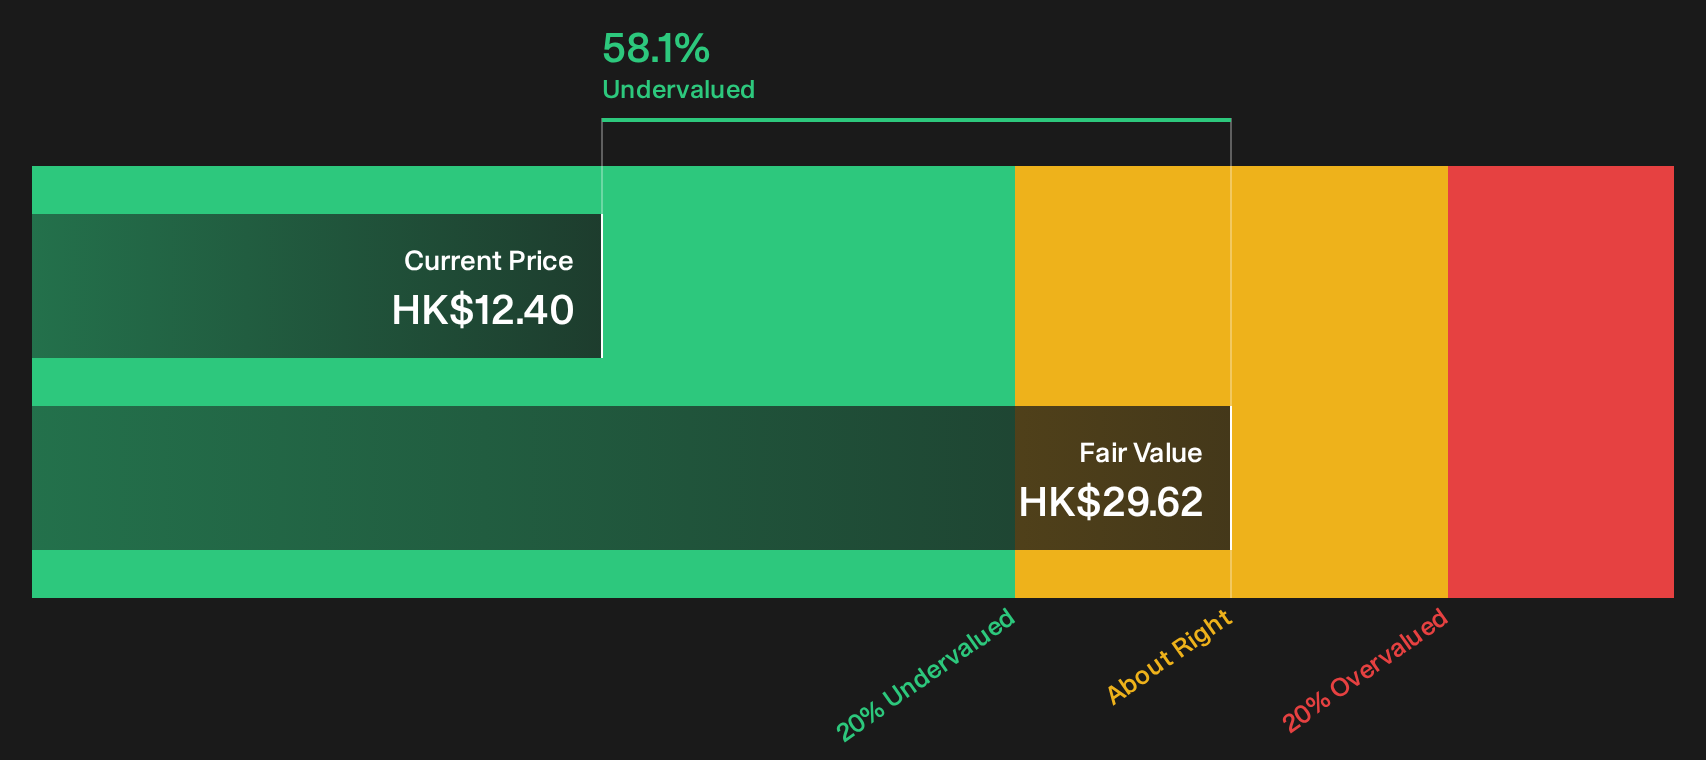
Simply Wall St performs a discounted cash flow (DCF) on every stock in the world every day (check out Yue Yuen Industrial (Holdings) for example). We show the entire calculation in full. You can track the result in your watchlist or portfolio and be alerted when this changes, or use our stock screener to discover 179 high quality undervalued stocks. If you save a screener we even alert you when new companies match - so you never miss a potential opportunity.
Next Steps
If the mixed signals on Yue Yuen Industrial (Holdings) leave you uncertain, consider acting promptly and review the full picture for yourself using the 2 key rewards and 1 important warning sign.
Looking for more investment ideas beyond Yue Yuen Industrial (Holdings)?
Ready to widen your watchlist and stress test your thinking against a broader set of opportunities before making your next move?
- Target resilience by scanning companies with strong financial footing using our list of solid balance sheet and fundamentals (198 results) that filters for balance sheet strength alongside solid fundamentals.
- Hunt for mispriced quality and use the 615 high quality undiscovered gems to surface underfollowed businesses with robust underlying metrics that many investors overlook.
- Dial down portfolio risk and focus on steadier profiles through the 229 resilient stocks with low risk scores which highlights stocks with lower overall risk scores.
This article by Simply Wall St is general in nature. We provide commentary based on historical data and analyst forecasts only using an unbiased methodology and our articles are not intended to be financial advice. It does not constitute a recommendation to buy or sell any stock, and does not take account of your objectives, or your financial situation. We aim to bring you long-term focused analysis driven by fundamental data. Note that our analysis may not factor in the latest price-sensitive company announcements or qualitative material. Simply Wall St has no position in any stocks mentioned.
Have feedback on this article? Concerned about the content? Get in touch with us directly. Alternatively, email editorial-team@simplywallst.com