
- PRICING
- LIVE QUOTES
- LEARN
- HELP


EN
Kodiak Sciences (KOD) Pulls Back After A Strong Year, Is The Valuation Still Too Rich?
Kodiak Sciences (KOD) drew fresh attention after recent trading left the share price at US$32.71, with returns over the past month and past 3 months both showing declines.
Recent trading pressure has taken some heat out of Kodiak Sciences, with the share price return down 14.66% over the past 30 days and 11.71% over 3 months, even though the year-to-date share price return is 25.71% and the 1-year total shareholder return is 117.92%. This points to fading short-term momentum after a very strong run for longer-term holders.
Compare Kodiak Sciences' recent pullback with other high potential ideas by scanning our hand picked 16 high quality undiscovered gems in a few minutes.
Kodiak Sciences has surged over the past year but slipped in recent weeks, which raises a practical call for you. Is this pullback enough to justify buying now, or does the valuation still argue for patience and a better entry later on?
Preferred price to book multiple of 33.6x for Kodiak Sciences: Is it justified?
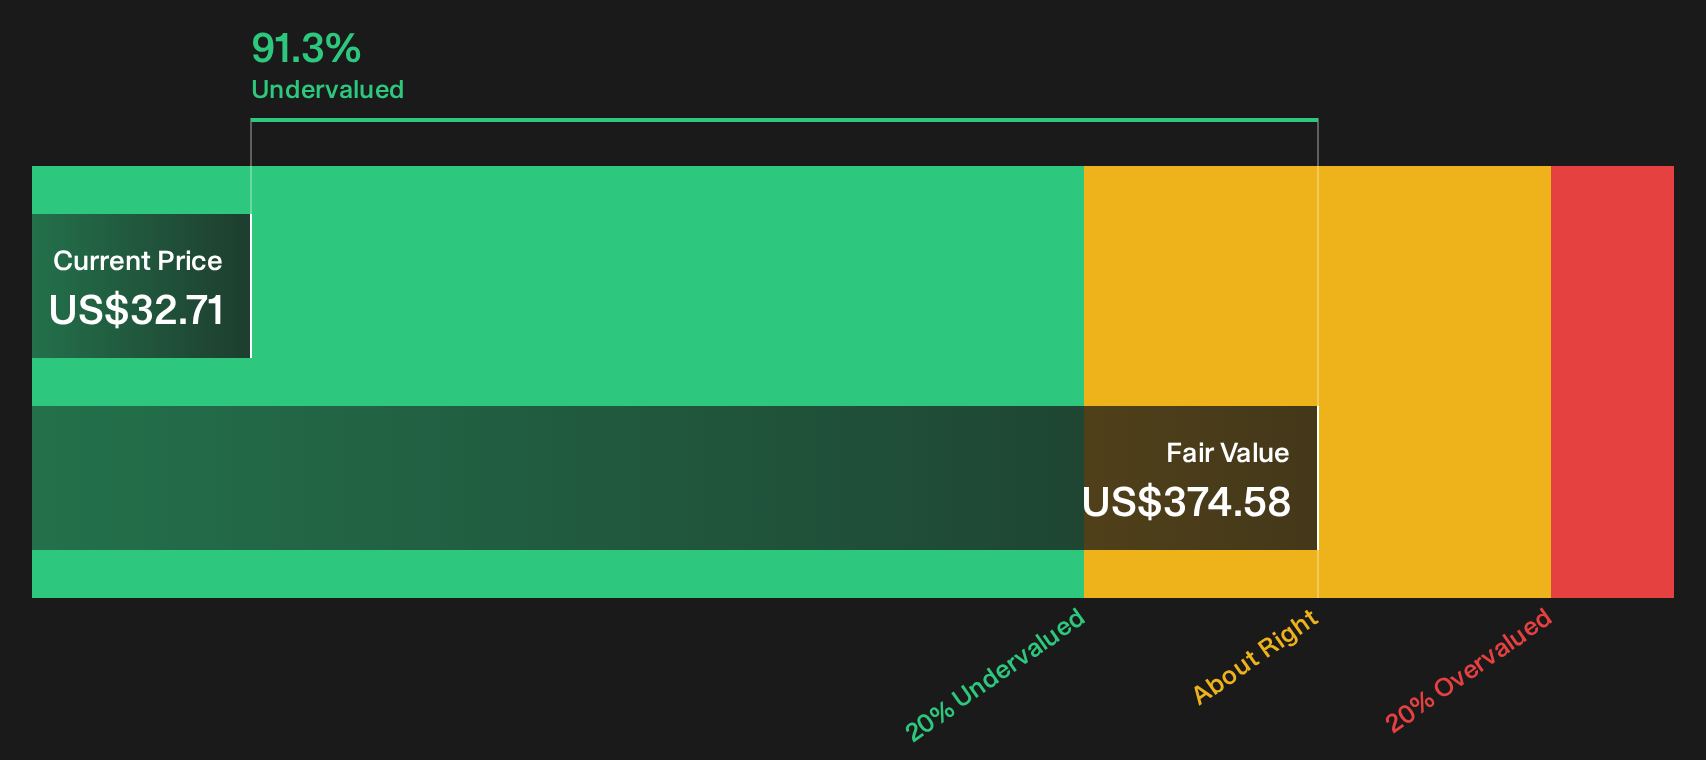
On simple valuation math, Kodiak Sciences screens as expensive on one lens yet cheap on another. The stock closed at $32.71, trades at a P/B of 33.6x and is flagged as trading 91.3% below the SWS estimate of its fair value, so you are looking at a very split picture.
The preferred yardstick here is the price to book ratio. P/B compares the market value of Kodiak Sciences to the accounting value of its net assets, which tends to matter a lot for pre revenue or early revenue biopharma groups where traditional earnings based metrics are not very useful.
Against the broader US Biotechs industry, a 33.6x P/B is very rich, because the sector average is 2.2x. That scale of premium suggests investors are paying up heavily for Kodiak Sciences' pipeline and expected growth, rather than current financials. For context, the SWS DCF work also points to the current share price trading well below a calculated future cash flow value of $374.58, which highlights how dependent any thesis is on the success and timing of those potential cash flows.
Compared with its closer peer set, the picture softens a little. Kodiak Sciences still carries a high P/B at 33.6x, though that level is below a peer average of 46.1x, so within that narrower group the ratio screens as cheaper than similar biotechs. That combination of a very high headline multiple versus the industry, a lower multiple versus peers, and a large gap to the DCF value estimate underlines how much judgement investors need to apply to the underlying assumptions rather than only the headline ratio.
See what the numbers say about this price — find out in our valuation breakdown.
Result: Price-to-book of 33.6x (OVERVALUED).
Still, Kodiak Sciences faces clear pressure points, including a current loss of US$241.994m and clinical trial outcomes that could sharply reset investor expectations.
Find out about the key risks to this Kodiak Sciences narrative.
Another view on Kodiak Sciences' value
The P/B work paints Kodiak Sciences as expensive, yet the SWS DCF model points in the opposite direction. On that cash flow lens, KOD at $32.71 is flagged as trading well below an estimated future value of $374.58. This raises a clear question: Is the risk in the science or in ignoring that gap?
For readers who want to see how that cash flow estimate is built from the ground up, Look into how the SWS DCF model arrives at its fair value.
Simply Wall St performs a discounted cash flow (DCF) on every stock in the world every day (check out Kodiak Sciences for example). We show the entire calculation in full. You can track the result in your watchlist or portfolio and be alerted when this changes, or use our stock screener to discover 35 high quality undervalued stocks. If you save a screener we even alert you when new companies match - so you never miss a potential opportunity.
Next Steps
Mixed signals on Kodiak Sciences often create the most interesting setups. Move quickly, test the assumptions yourself, and weigh both sides of the story by reviewing the 2 key rewards and 4 important warning signs.
Looking for more Kodiak Sciences style investment ideas?
If Kodiak Sciences has you rethinking where the next big opportunity might come from, do not stop at a single ticker. Use the Simply Wall St screener tools to uncover ideas that fit your risk level, preferred business quality and time horizon.
- Target potential mispricing by scanning a curated 35 high quality undervalued stocks that combine quality fundamentals with prices that may not fully reflect them yet.
- Prioritize resilience by focusing on a list of solid balance sheet and fundamentals (23 results) that can better handle funding cycles, rate moves and unexpected shocks.
- Tilt toward stability by zeroing in on 7 dividend fortresses that already return cash to shareholders rather than relying purely on future capital gains.
This article by Simply Wall St is general in nature. We provide commentary based on historical data and analyst forecasts only using an unbiased methodology and our articles are not intended to be financial advice. It does not constitute a recommendation to buy or sell any stock, and does not take account of your objectives, or your financial situation. We aim to bring you long-term focused analysis driven by fundamental data. Note that our analysis may not factor in the latest price-sensitive company announcements or qualitative material. Simply Wall St has no position in any stocks mentioned.
Have feedback on this article? Concerned about the content? Get in touch with us directly. Alternatively, email editorial-team@simplywallst.com