
- PRICING
- LIVE QUOTES
- LEARN
- HELP


EN
Out of 200 Large-Cap, 1-Month Losers, This Video Game Stock Stands Out
Buy low and sell high: that’s an oft-repeated adage that sounds great in principle but is often difficult to actualize. A prime example may be video-game publisher Take-Two Interactive (TTWO). On paper, it might seem like a contrarian dream. TTWO stock ranks as a 40% Sell by the Barchart Technical Opinion indicator. It also represents one of the 200 large-capitalization tickers that suffered the biggest one-month percentage losses.
To the uninitiated, those stats don’t appear particularly encouraging. However, there’s a common assumption that with so much bad news baked in, these beaten-down securities are due for a comeback. But it’s still worth asking the million-dollar question: which ones?
You can’t just assume that every publicly traded company that suffers an extended downturn represents a contrarian opportunity; otherwise, people would just buy any time they see red ink. No, there has to be an independent justification beyond just the red ink.
Interestingly, within this list of large-cap “losers,” 49 of them have printed what I would call a 3-7-D quantitative sequence; that is, in the last 10 weekly candlesticks (two months), only three of the sessions were positive. Mathematically, that would mean that 70% of the defined period saw net selling pressure — which I believe to be a statistically intriguing setup.
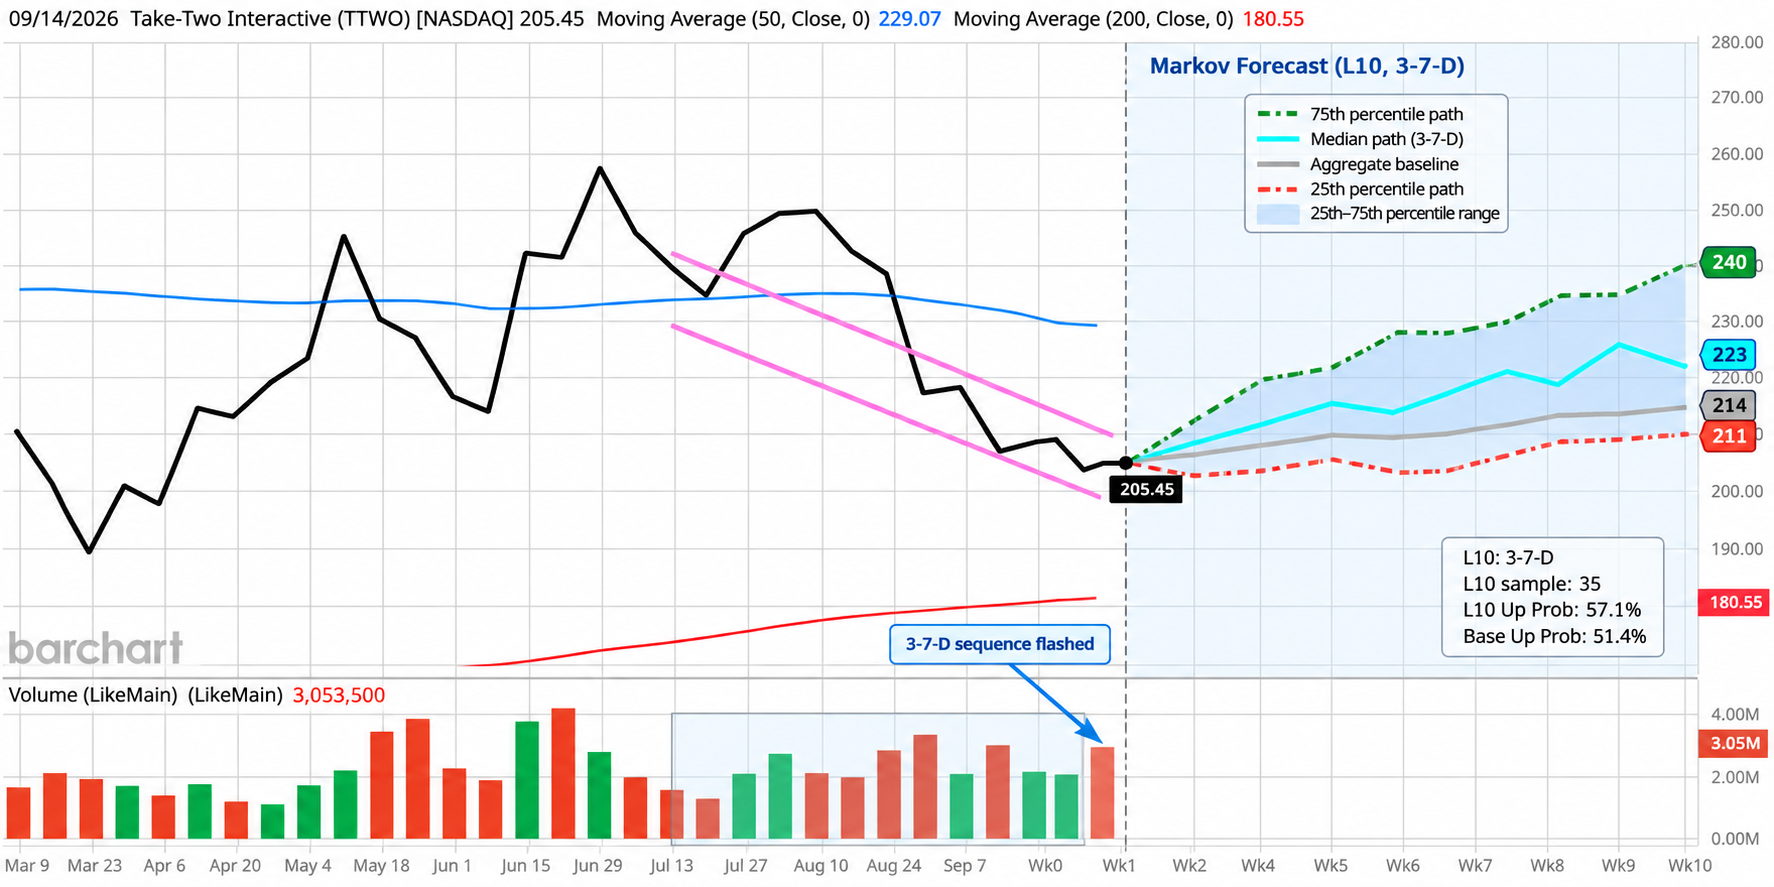
However, I’m not affirming the consequent by simply presupposing that the 3-7-D sequence necessarily leads to upside. Rather, I test the data to see if there is a positive variance between the signal and the noise.
As it turns out, there may be an exploitable signal for TTWO stock.
Laying Out the Statistical Framework for Take-Two Stock
Since January 2019, we know that out of the 35 times (on a rolling basis) that the aforementioned sequence has flashed, there is an average positive variance of around 3.81% over the subsequent 10 weeks between the signal and the aggregate baseline.
In other words, when we create a composite picture of what may happen over the next several weeks following the flashing of the 3-7-D sequence, traders may expect a nearly 4% positive difference relative to a composite picture of all 10-week sequences. There would seem to be, then, an incentive to consider a capped-risk, capped-reward options strategy.
Moreover, because near-expiry options will impose a lower time-value cost, the most intrepid speculators may consider bull call spreads expiring Oct. 16. Specifically, I’m looking at the 210/220 bull spread. Here, TTWO stock must trigger the $220 second-leg strike price on expiration. If so, the net debit (cash outlay) of $350 will turn into a profit of $650, a payout of almost 186%.
It sounds great on paper due to the asymmetric nature of the trade. Basically, you would be risking a relatively small amount in the hopes of attaining a big reward. However, the problem comes in the form of the low odds of success.
TTWO Stock Faces an Uphill Probabilistic Battle
As circumstances currently stand, Wall Street’s options pricing mechanism pegs the probability of profit (breakeven) at only 34.9%; that is, Take-Two stock has a very modest chance of hitting $213.50 on Oct. 16. Further, a reverse-engineering of Barchart’s Expected Move calculator reveals that the odds of TTWO hitting $220 on expiration sit at only 25.62%.
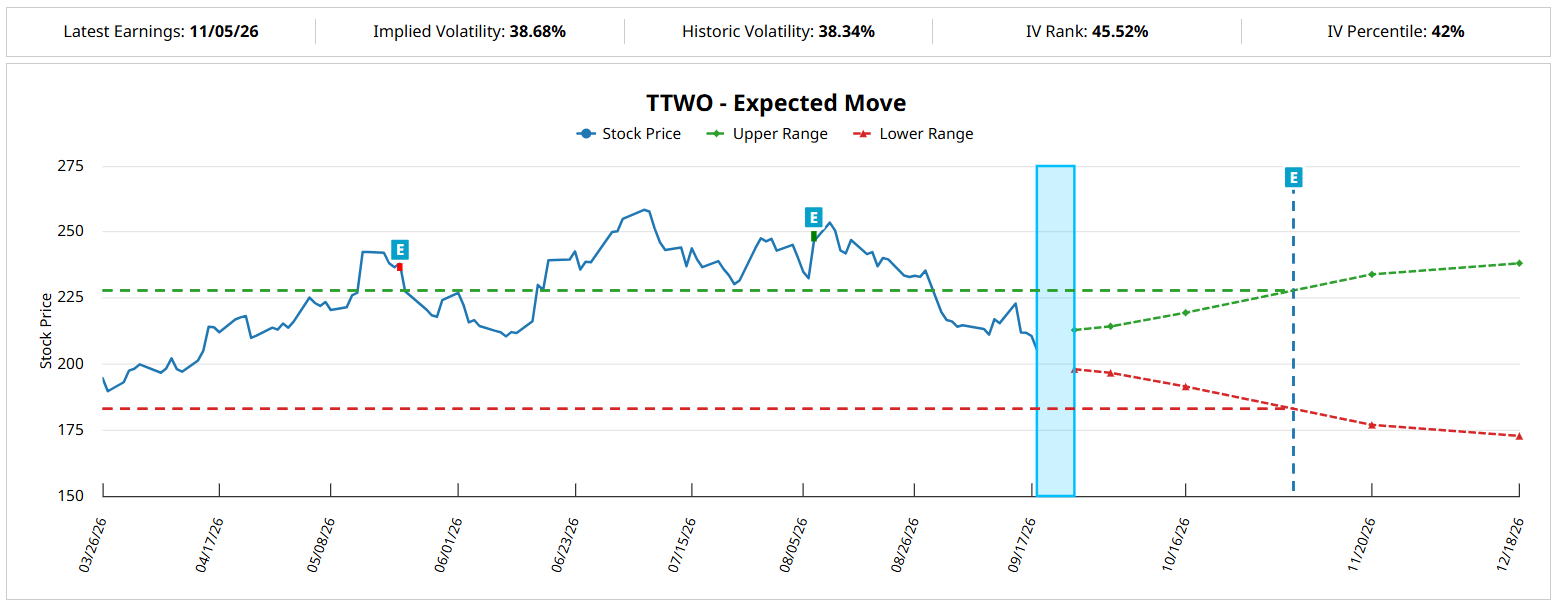
Obviously, these aren’t great stats but it’s also worth examining the framework of how these probabilities are calculated. To make a long story short, these probabilities assume that TTWO stock will undergo a random walk between now and the expiration date, with the current implied volatility (IV) serving as the constant across the journey.
However, one nuance of this framework is that the math treats the projected future of Take-Two stock as being independent of the past. Stated differently, the path that TTWO stock took to get to $205.45 (where the analysis begins) doesn’t influence the calculations.
On the other hand, alternative models may assume that the future is dependent on the past; that is, how TTWO stock got to $205.45 may influence its forward trajectory.
Under this assumed framework, the breakeven probability is calculated as 57.1%. Of the 35 times that TTWO flashed the 3-7-D sequence, it has exceeded the equivalent of the $213.50 breakeven price a total of 20 times on week 4 (coinciding with the Oct. 16 expiration date). In terms of full profitability at $220, the odds dips to 25.7%, which is the same success ratio that Wall Street has calculated.
The Main Takeaway
It’s necessary to point out that all arguments about the unknown future are presuppositional. Since no one knows with absolute certainty what will happen, an argument needs to start with a presupposition to move the discussion forward.
What’s fascinating about TTWO stock is that the end target of $220 on Oct. 16 carries the same probability from the two models mentioned above; one assuming a random walk, the other assuming a nonrandom walk. However, the breakeven probabilities are significantly different, which tells me this: from the observed data, TTWO tends to lean toward a $218 median terminal target over the next four weeks.
Such a forecast puts it well above the breakeven price but a little shy of the $220 target. Still, with a little bit of luck, TTWO stock could conceivably trigger the second-leg strike. And because the risk-reward is asymmetric in favor of the debit-side options trader, aggressive speculators may want to keep close tabs on Take-Two Interactive.
On the date of publication, Josh Enomoto did not have (either directly or indirectly) positions in any of the securities mentioned in this article. All information and data in this article is solely for informational purposes. For more information please view the Barchart Disclosure Policy here.