
- PRICING
- LIVE QUOTES
- LEARN
- HELP


EN
Wayfair (W) Joins Homebuilders Index On A Valuation Debate
Wayfair (W) just joined the S&P Homebuilders Select Industry Index, shortly after presenting at the Goldman Sachs Communacopia + Technology Conference 2026. Index inclusion can reshape who owns the stock and how it trades.
Wayfair’s share price has moved around that latest index news, with a 90-day share price return of 20.75% and a 30-day gain of 0.93%. The stock’s 1-year total shareholder return of 20.13% and 3-year total shareholder return of 72.70% point to momentum that has been building over a longer stretch despite a weaker 5-year total shareholder return.
Scan beyond Wayfair and see how other home and consumer names are trading around inflection points using the hand picked 16 high quality undiscovered gems for fresh ideas off the beaten path.
Wayfair has a big online home goods platform and fresh index demand lining up behind the stock. The real tension now is whether that business strength is already fully baked into today’s price.
Most Popular Narrative: 12% Overvalued
Wayfair last closed at $102.46, while the most followed narrative pegs fair value at $91.74 using an 8.87% discount rate and detailed cash flow assumptions. As a result, the gap between price and model value is hard to ignore.
Wayfair's CastleGate logistics network and strategic cost efficiencies can boost revenue growth and improve net margins over time. New initiatives, including Wayfair Verified and physical stores, can enhance customer engagement and drive higher sales.
See why 13 investors see Wayfair as 12% overvalued.
Result: Fair Value of $91.74 (OVERVALUED)
Still, Wayfair’s heavy advertising spend and its decision to pull back from Germany highlight how both customer acquisition costs and international execution could challenge that positive narrative.
Find out about the key risks to this Wayfair narrative.
Another View On Wayfair’s Valuation
Analyst narratives put Wayfair at $91.74 per share using detailed earnings and margin assumptions, yet Simply Wall St’s DCF model tells a very different story. On that cash flow view, the stock at $102.46 is described as trading below an estimated future cash flow value of $209.01. This frames Wayfair as undervalued rather than 12% overvalued. When two frameworks land this far apart, which set of assumptions feels more realistic to you as a shareholder?
Look into how the SWS DCF model arrives at its fair value.
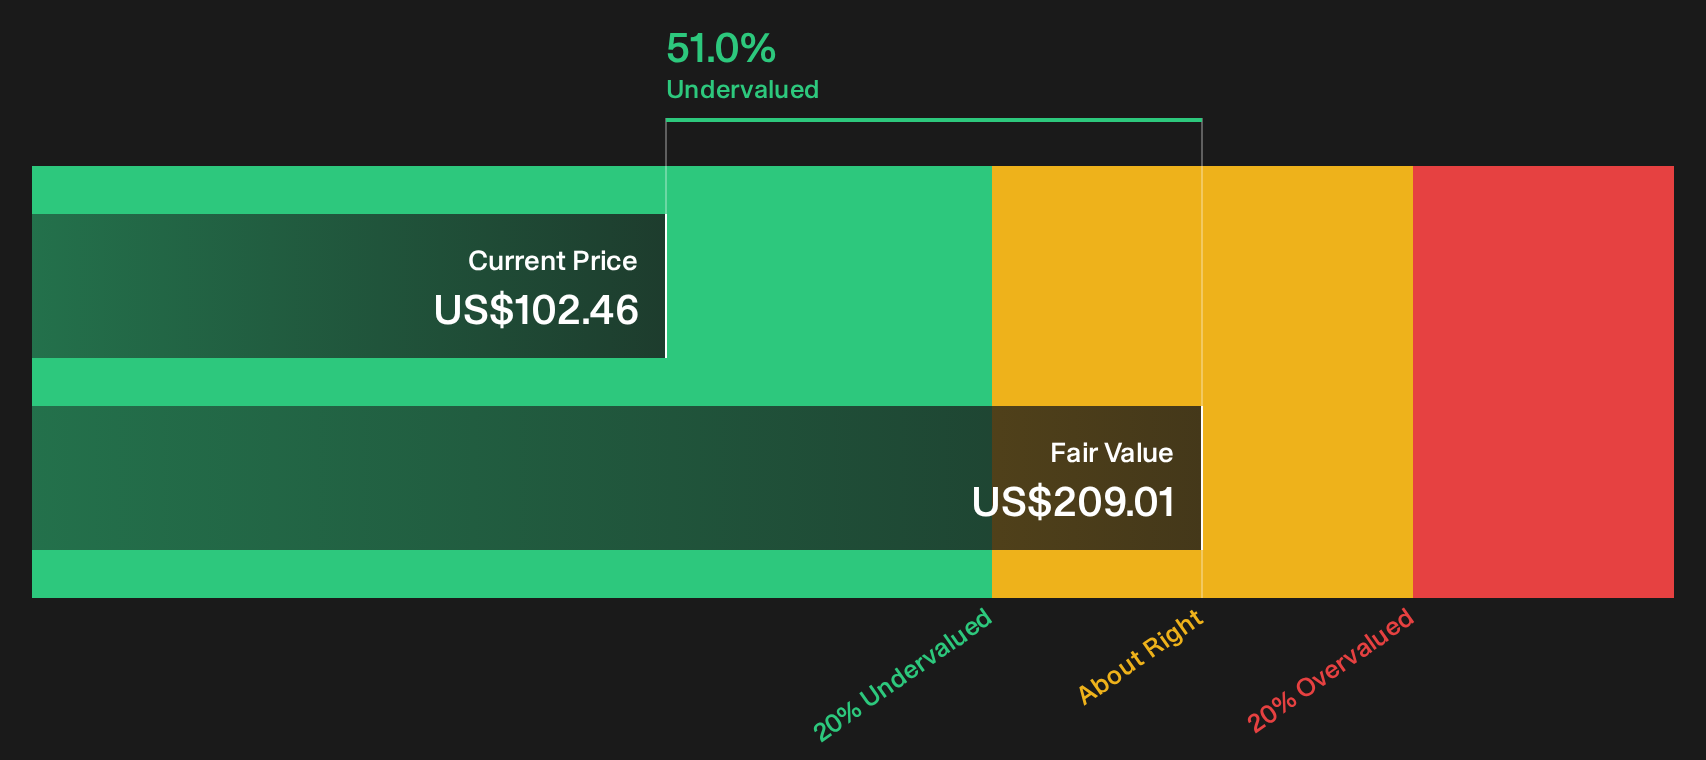
Simply Wall St performs a discounted cash flow (DCF) on every stock in the world every day (check out Wayfair for example). We show the entire calculation in full. You can track the result in your watchlist or portfolio and be alerted when this changes, or use our stock screener to discover 35 high quality undervalued stocks. If you save a screener we even alert you when new companies match - so you never miss a potential opportunity.
Next Steps
Mixed messages on Wayfair’s value story so far. Act while the data is fresh, review both the upside and downside, and weigh the 3 key rewards and 3 important warning signs.
Looking for more investment ideas beyond Wayfair?
Wayfair might be on your radar today, but you can widen your opportunity set fast by scanning other stocks through focused screeners built around fundamentals and risk.
- Hunt for potential value opportunities that combine quality and attractive pricing by reviewing the 35 high quality undervalued stocks.
- Strengthen your capital base with businesses that prioritize financial resilience through the list of solid balance sheet and fundamentals (23 results).
- Dial down volatility in your portfolio and concentrate on steadier performers using the 30 resilient stocks with low risk scores.
This article by Simply Wall St is general in nature. We provide commentary based on historical data and analyst forecasts only using an unbiased methodology and our articles are not intended to be financial advice. It does not constitute a recommendation to buy or sell any stock, and does not take account of your objectives, or your financial situation. We aim to bring you long-term focused analysis driven by fundamental data. Note that our analysis may not factor in the latest price-sensitive company announcements or qualitative material. Simply Wall St has no position in any stocks mentioned.
Have feedback on this article? Concerned about the content? Get in touch with us directly. Alternatively, email editorial-team@simplywallst.com