
- PRICING
- LIVE QUOTES
- LEARN
- HELP


EN
Perpetual (ASX:PPT) Could Be 11% Undervalued Following FTSE All World Index Removal
Index removal puts Perpetual under a new spotlight
Perpetual (ASX:PPT) has been removed from the FTSE All-World Index in USD terms, an index reshuffle that can prompt selling by passive funds and shift how some investors view the stock.
The index exit comes at a time when Perpetual’s recent momentum has been picking up, with a 1 day share price return of 4.64% and a 90 day share price return of 25.32%. However, its 1 year total shareholder return of 9.91% contrasts with a 5 year total shareholder return that is down 29.5%. This suggests that short term sentiment has strengthened while the longer term picture remains more mixed.
Scan how Perpetual compares with other financial stocks reacting to index reshuffles by checking the hand picked 7 resilient stocks with low risk scores that have held up better under similar pressure.
Perpetual now trades below both internal fair value estimates and the A$20.53 analyst target, even after the recent rebound. Is that a signal the market is too cautious, or a warning that it is not cautious enough?
Most Popular Narrative: 10.5% Undervalued
Perpetual last closed at A$19.60. The most followed valuation narrative, according to Jamesiskindacool, puts fair value at A$21.897 per share. This frames the current discount in sharper relief than the modest analyst target gap.
At A$21.897 per share, Perpetual Limited (ASX: PPT) appears reasonably valued based on its current operating performance, the planned sale of its Wealth Management business and the recent takeover proposal. Using approximately 113.3 million shares on issue, the assessed price values Perpetual’s shares at around A$2.48 billion.
See why 5 investors see Perpetual as 10% undervalued.
Result: Fair Value of A$21.897 (UNDERVALUED)
Still, Perpetual faces pressure from revenue that recently declined and from assets under management that fell over the March quarter, which could challenge confidence in that valuation.
Find out about the key risks to this Perpetual narrative.
Another View on Perpetual’s Valuation
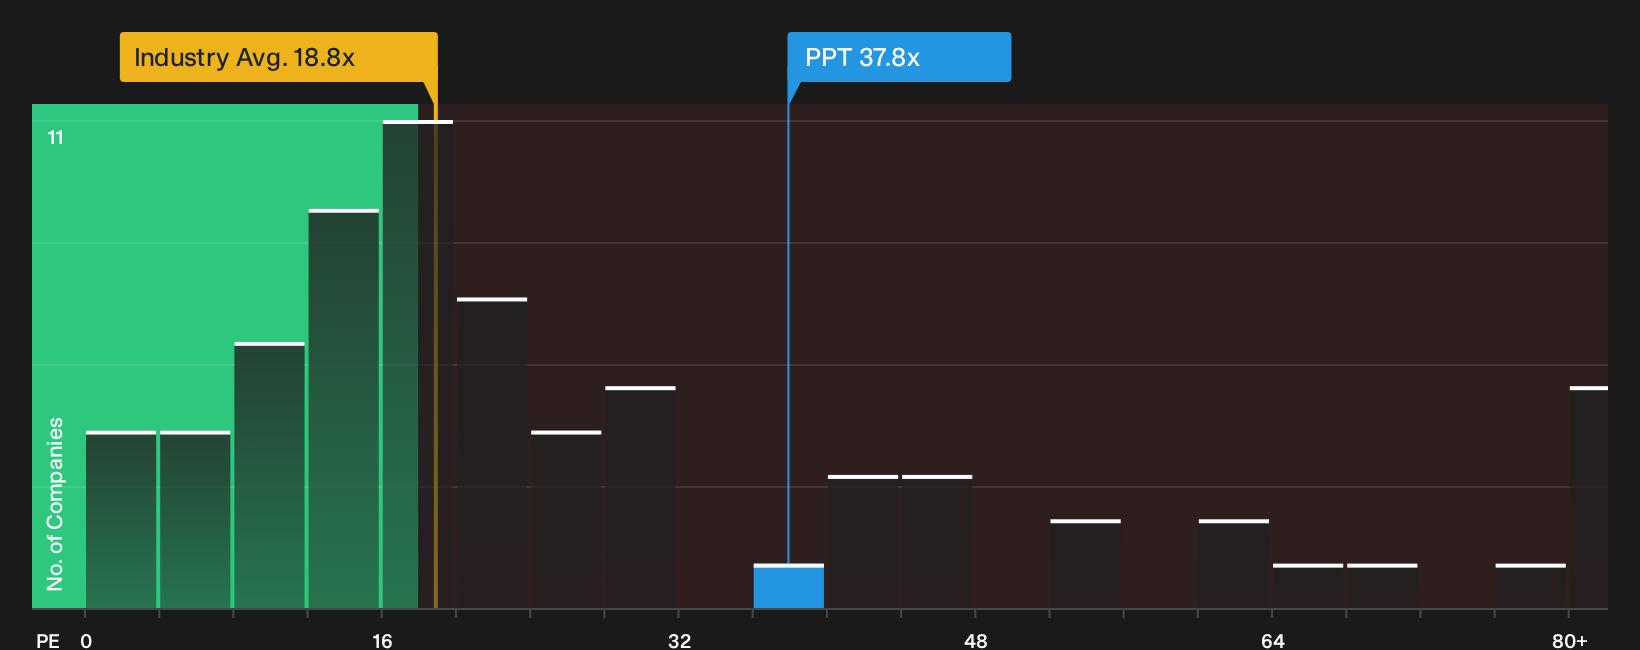
Perpetual may look undervalued on narrative and DCF style fair value estimates, yet the simple earnings multiple paints a tougher picture. The shares trade on a P/E of 37.8x, compared with 20.2x for peers, 18.8x for the broader Capital Markets group and a fair ratio of 19.6x. That is a sizeable premium. It raises a straight question for investors: Is the discount to fair value real, or is the earnings multiple signalling that expectations already run hot?
For a closer look at how that earnings gap could matter if the market drifts back toward the fair ratio, check out See what the numbers say about this price — find out in our valuation breakdown..
Next Steps
Mixed signals around Perpetual’s valuation and index exit can feel messy, so move fast, test the numbers yourself, and weigh both the rewards and the risks by reviewing the 3 key rewards and 2 important warning signs.
Looking for more Perpetual sized investment ideas?
If Perpetual has you thinking harder about valuation and risk, do not stop there. Broaden your watchlist now so you are not chasing the next move after it happens.
- Target quality at a discount and review the 5 high quality undervalued stocks that already combine solid fundamentals with appealing pricing.
- Strengthen your income stream by checking the 3 dividend fortresses built around stocks with robust payouts at the centre of their appeal.
- Ring fence your downside and scan the list of solid balance sheet and fundamentals (12 results) to focus on businesses with financial footing that can absorb tougher conditions.
This article by Simply Wall St is general in nature. We provide commentary based on historical data and analyst forecasts only using an unbiased methodology and our articles are not intended to be financial advice. It does not constitute a recommendation to buy or sell any stock, and does not take account of your objectives, or your financial situation. We aim to bring you long-term focused analysis driven by fundamental data. Note that our analysis may not factor in the latest price-sensitive company announcements or qualitative material. Simply Wall St has no position in any stocks mentioned.
Have feedback on this article? Concerned about the content? Get in touch with us directly. Alternatively, email editorial-team@simplywallst.com