
- PRICING
- LIVE QUOTES
- LEARN
- HELP


EN
Sumitomo Electric Industries (TSE:5802) Sets AI Fiber Standards, Is The Stock Still Cheap?
Sumitomo Electric Industries (TSE:5802) is back in focus after joining AFL, Corning and TeraHop to publish the SDM4 multicore fiber technical specification for AI data centers and campus networks.
Recent trading has been mixed. Sumitomo Electric Industries has a 1-day share price return of 1.36% and a year-to-date share price gain of 24.02%. The 90-day share price return has fallen 38.36%, while the 5-year total shareholder return of 538.04% points to strong long-term momentum.
Scan how Sumitomo Electric Industries fits into the wider AI infrastructure build out by comparing it with the hand picked 88 AI infrastructure stocks shaping next generation data centers.
After a sharp 90-day pullback following strong multi-year gains and fresh AI fiber news, the question is simple: Is Sumitomo Electric Industries better approached on this dip or after a deeper reset in the valuation work that follows?
Price-to-Earnings of 16.2x: Is it justified?
On the latest numbers, Sumitomo Electric Industries trades on a P/E of 16.2x, which lines up with a share price of ¥2,080.5 and a market view that already bakes in meaningful earnings power compared with local peers.
The P/E multiple compares the current share price to earnings per share, so it reflects what investors are willing to pay for each unit of profit. For a diversified industrial and auto components supplier with exposure to power, communications and electronics, this ratio is often used as a shorthand for how confident the market is in the durability of those earnings.
For Sumitomo Electric Industries, the current valuation sits between two signals. On one side, the stock is described as good value compared with an estimated fair P/E of 25.8x. This suggests investors are not paying the higher multiple that a regression based "fair" level indicates the business could support. On the other side, the shares are labelled expensive relative to both the JP Auto Components industry average of 9.8x and a peer average of 12x. This points to a market that is pricing its profit stream more generously than many direct competitors.
The spread is wide. A P/E of 16.2x is materially higher than sector and peer benchmarks, yet materially lower than the 25.8x fair ratio level that the model indicates the valuation could move toward if sentiment and fundamentals remained aligned.
Explore the SWS fair ratio for Sumitomo Electric Industries.
Result: Price-to-Earnings of 16.2x (OVERVALUED)
Still, the recent 38.36% 90-day share price pullback and a richer P/E than auto component peers leave Sumitomo Electric Industries exposed if earnings or AI fiber demand disappoint.
Find out about the key risks to this Sumitomo Electric Industries narrative.
Another View on Sumitomo Electric Industries' Value
The second lens tells a different story. Our DCF model values Sumitomo Electric Industries at ¥2,913.07 per share, which is above the current ¥2,080.5 price. That points to the stock trading at roughly a 28.6% discount. So is the market mispricing long term cash flows, or is the model too generous?
Look into how the SWS DCF model arrives at its fair value.
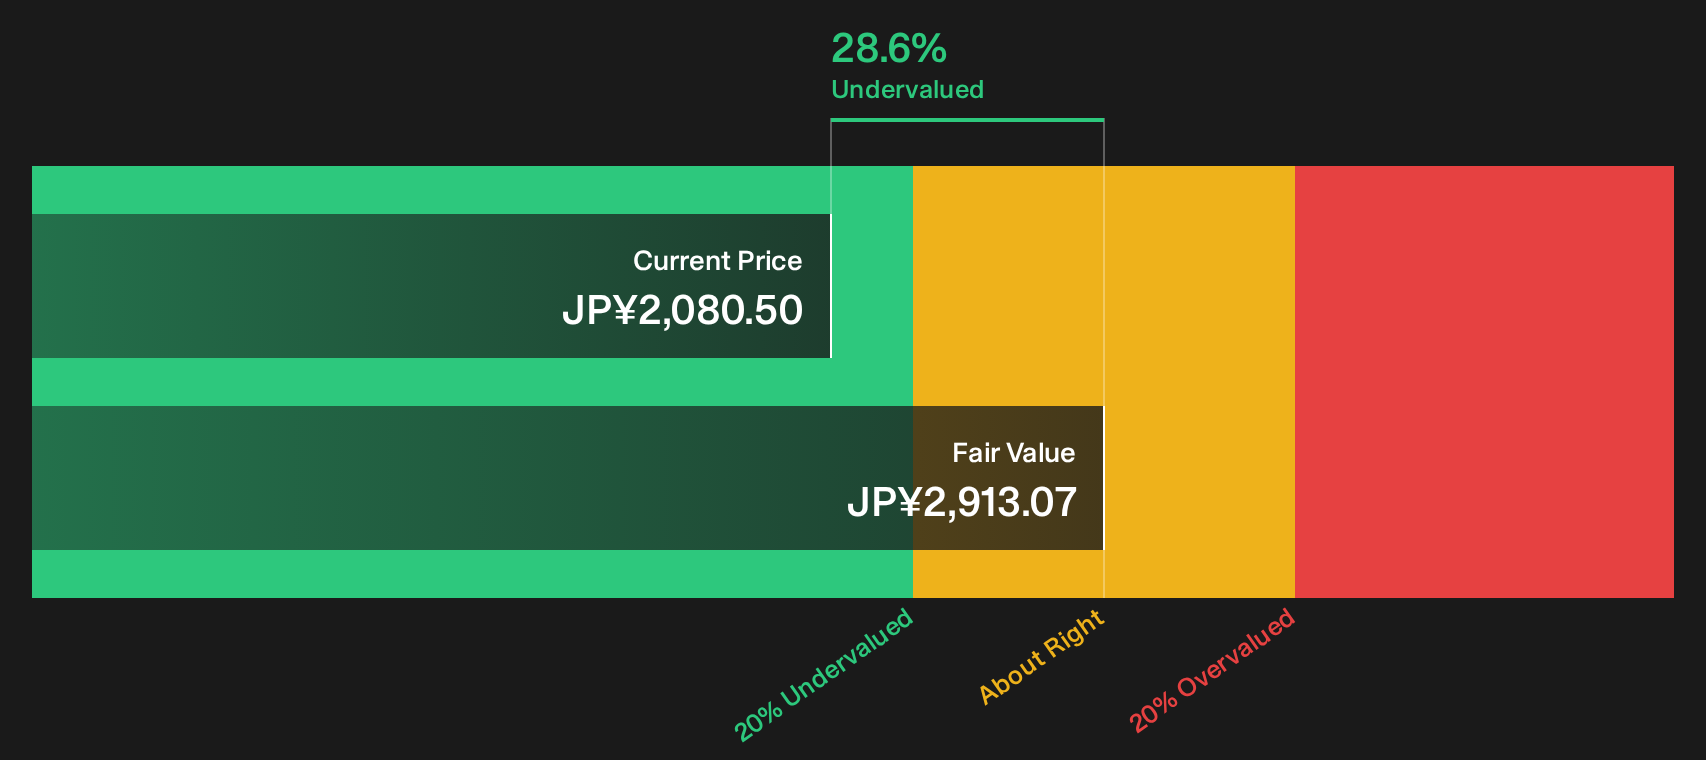
Simply Wall St performs a discounted cash flow (DCF) on every stock in the world every day (check out Sumitomo Electric Industries for example). We show the entire calculation in full. You can track the result in your watchlist or portfolio and be alerted when this changes, or use our stock screener to discover 17 high quality undervalued stocks. If you save a screener we even alert you when new companies match - so you never miss a potential opportunity.
Next Steps
Mixed signals on valuation and sentiment can be useful. Use them as a prompt to review the data, stress test your own thesis, and weigh both sides of the story by checking the 3 key rewards and 2 important warning signs
Looking for more investment ideas beyond Sumitomo Electric Industries?
If Sumitomo Electric Industries sharpened your focus, you can broaden your opportunity set with a few carefully filtered lists that surface different types of potential candidates.
- Target potential mispricings by scanning the 17 high quality undervalued stocks that combine quality fundamentals with compressed valuations.
- Strengthen your income side by reviewing the 14 dividend fortresses built around higher-yield payouts and balance sheet support.
- Reduce portfolio stress by checking the 21 resilient stocks with low risk scores that screens for resilient businesses with lower risk profiles.
This article by Simply Wall St is general in nature. We provide commentary based on historical data and analyst forecasts only using an unbiased methodology and our articles are not intended to be financial advice. It does not constitute a recommendation to buy or sell any stock, and does not take account of your objectives, or your financial situation. We aim to bring you long-term focused analysis driven by fundamental data. Note that our analysis may not factor in the latest price-sensitive company announcements or qualitative material. Simply Wall St has no position in any stocks mentioned.
Have feedback on this article? Concerned about the content? Get in touch with us directly. Alternatively, email editorial-team@simplywallst.com