
- PRICING
- LIVE QUOTES
- LEARN
- HELP


EN
Is Electra (TASE:ELTR) Undervalued On FTSE All World Index Inclusion?
Electra (TASE:ELTR) has been added to the FTSE All-World Index in US dollar terms. This event can draw extra attention from global index trackers and larger institutional investors.
Recent trading has been mixed for Electra, with the share price at ₪114.2 after a 30-day share price return of 11.09% but a 90-day share price return that declined 3.14%. Even so, the 1-year total shareholder return of 35.38% and 3-year total shareholder return of 60.84% indicate that momentum has been building over longer periods as income and reinvested dividends compound alongside price moves.
Scan how Electra compares with other construction and infrastructure plays by reviewing the hand picked list of solid balance sheet and fundamentals (198 results) that may also be drawing fresh attention from global funds.
After Electra’s index-driven jump, investors are weighing a reported 60% intrinsic discount against the market’s hesitation. Is this a genuine mispricing, or a cautious read on risk, before digging into valuation?
Preferred P/E of 45.1x for Electra: Is it justified?
On traditional metrics, Electra looks expensive at a P/E of 45.1x, especially when the last close sits at ₪114.2 and recent earnings have moved in the opposite direction.
The P/E ratio compares the current share price with earnings per share and effectively tells you how many years of current profit the market is willing to pay for. For a construction and infrastructure group like Electra, that figure often reflects how reliable investors believe its profit stream is, given the project-based nature of the work.
Earnings have declined by 4.5% per year over the past 5 years and fell 11% in the most recent year, yet the market is still assigning a 45.1x P/E. That combination points to investors paying a high price for earnings that have not been growing, which can indicate expectations that past declines are not the long term norm.
Compared with the IL Construction industry average of 33x, Electra trades on a much richer multiple, so the market is clearly pricing the stock more optimistically than the sector as a whole even without confirmed growth forecasts.
Result: Price-to-earnings of 45.1x (OVERVALUED).
Still, the rich 45.1x P/E for Electra can quickly look exposed if earnings weaken further or if sentiment toward construction and infrastructure contractors cools.
Find out about the key risks to this Electra narrative.
Another View On Electra’s Value
The high P/E makes Electra look expensive, yet our DCF model paints a very different picture. At ₪114.2, the stock trades well below an estimated future cash flow value of ₪288.98. This implies a large discount if those cash flow assumptions hold up.
This gap between earnings based pricing and cash flow based valuation raises a simple question: Is the market overpaying for current profits, or underpricing the long term cash generation story that the SWS DCF model suggests?
Look into how the SWS DCF model arrives at its fair value.
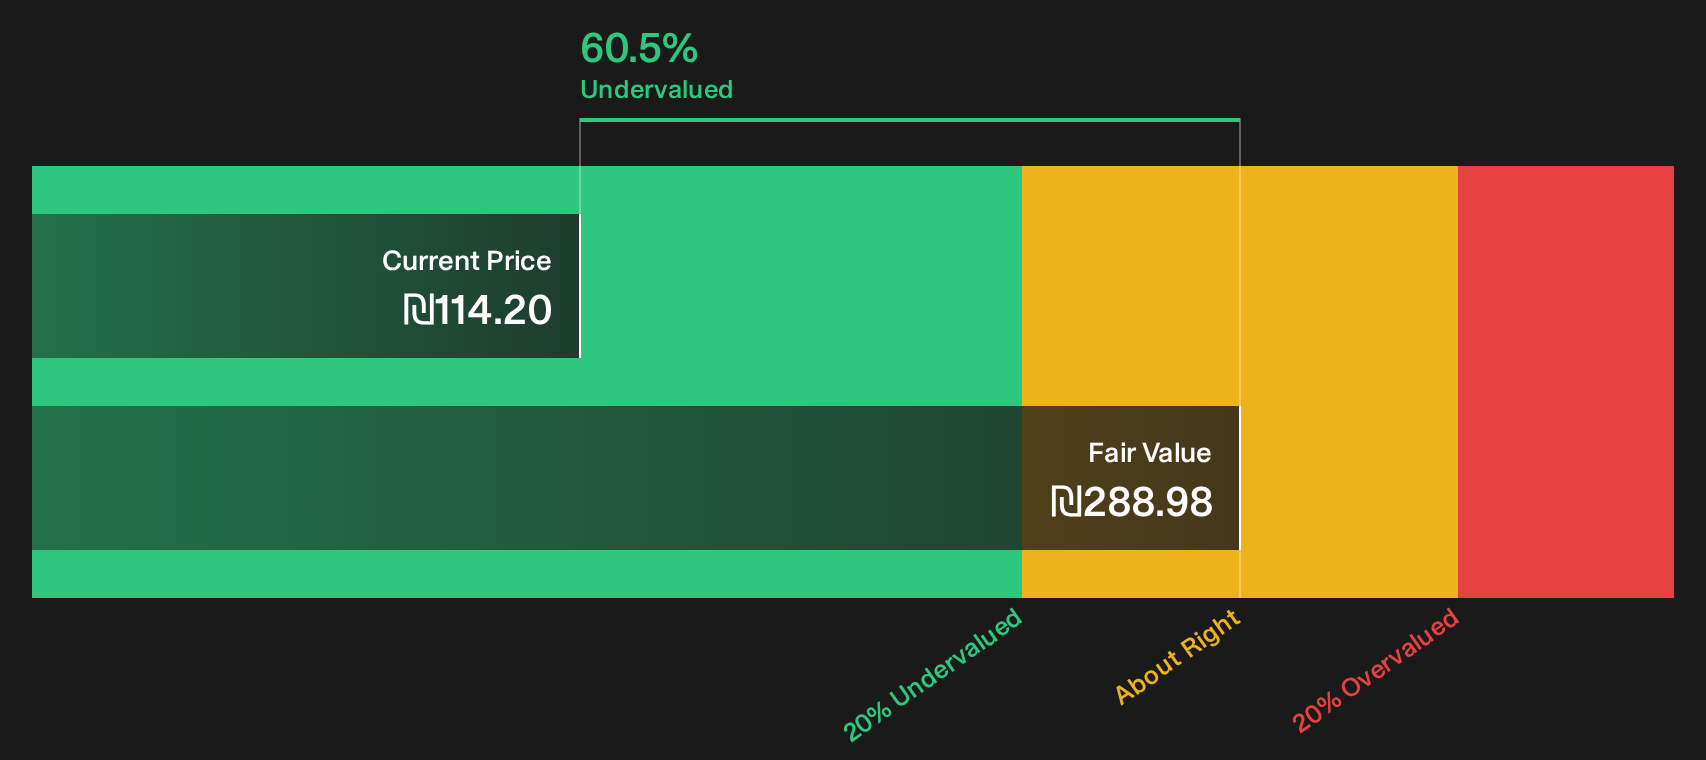
Simply Wall St performs a discounted cash flow (DCF) on every stock in the world every day (check out Electra for example). We show the entire calculation in full. You can track the result in your watchlist or portfolio and be alerted when this changes, or use our stock screener to discover 179 high quality undervalued stocks. If you save a screener we even alert you when new companies match - so you never miss a potential opportunity.
Next Steps
Curious whether the market is being too harsh or too generous with Electra right now? Act while sentiment is fresh and weigh the trade off between caution and optimism by reviewing the 1 key reward and 4 important warning signs.
Looking for more investment ideas beyond Electra?
If Electra has sharpened your appetite for opportunities, do not stop here. Use the screener to spot fresh ideas that fit your own approach.
- Target potential bargains by running a focused search through 179 high quality undervalued stocks that filters for companies with strong fundamentals trading at what may be discounted prices.
- Prioritise resilience and sleep easier by scanning 226 resilient stocks with low risk scores to see businesses that carry lower overall risk scores.
- Hunt for future standouts early by reviewing the 614 high quality undiscovered gems that combine quality metrics with limited existing market attention.
This article by Simply Wall St is general in nature. We provide commentary based on historical data and analyst forecasts only using an unbiased methodology and our articles are not intended to be financial advice. It does not constitute a recommendation to buy or sell any stock, and does not take account of your objectives, or your financial situation. We aim to bring you long-term focused analysis driven by fundamental data. Note that our analysis may not factor in the latest price-sensitive company announcements or qualitative material. Simply Wall St has no position in any stocks mentioned.
Have feedback on this article? Concerned about the content? Get in touch with us directly. Alternatively, email editorial-team@simplywallst.com