
- PRICING
- LIVE QUOTES
- LEARN
- HELP


EN
Shanghai Henlius Biotech (SEHK:2696) Moved Today, What Is Drawing Attention?
Shanghai Henlius Biotech (SEHK:2696) drew attention after regulators in mainland China accepted its New Drug Application for HLX14, a denosumab biosimilar targeting cancer related bone disease and giant cell tumor of bone.
The regulatory progress comes as Shanghai Henlius Biotech’s 1-day share price return of 2.23% contrasts with a 7-day decline of 5.24% and a 30-day drop of 12.97%. The year-to-date share price return of 1.88% sits beside a 1-year total shareholder return that declined 23.07% and a very large 3-year total shareholder return of about 5x. This suggests that momentum has cooled recently after a powerful multi-year run.
Scan other biopharma opportunities moving around major catalysts by reviewing our curated list of 614 high quality undiscovered gems alongside Shanghai Henlius Biotech's latest HLX14 milestone.
Shanghai Henlius Biotech now trades at a heavy discount to both analyst targets and some intrinsic value estimates after this HLX14 update. Is that caution about execution risk fair, or has the market swung too far?
Price-to-Earnings of 32x: Is it justified?
Shanghai Henlius Biotech last closed at HK$59.70 while trading on a P/E of 32x, which screens as expensive relative to its own fair P/E estimate and to peers, even with the recent pullback around the HLX14 headline.
The P/E ratio compares the current share price to earnings per share and, for a biopharma group like Shanghai Henlius Biotech, effectively reflects what investors are willing to pay today for each unit of profit given its pipeline, product mix, and risk profile.
With earnings forecast to grow 13.45% per year and revenue expected to advance 6.3% annually, the current 32x multiple suggests the market is putting a rich price on those forward profits compared with the estimated fair P/E of 20.8x. That level is what the valuation work suggests could be more in line with the underlying earnings profile.
Peer comparisons underline the stretch. The stock trades on a P/E of 32x versus a Hong Kong Biotechs industry average of 16.8x and a peer group average of 28.6x, which points to investors paying a clear premium that may be hard to justify if growth or margins fall short of expectations.
Explore the SWS fair ratio for Shanghai Henlius Biotech.
Result: Price-to-earnings of 32x (OVERVALUED)
Still, if analyst price targets prove overly optimistic or if HLX14 progress slows, the premium P/E that Shanghai Henlius Biotech carries could compress quickly.
Find out about the key risks to this Shanghai Henlius Biotech narrative.
Another View on Shanghai Henlius Biotech’s Value
A different lens tells a very different story. Shanghai Henlius Biotech is trading at HK$59.70, while our DCF model estimates a future cash flow value of HK$201.47. That gap suggests the stock screens as heavily undervalued on this approach. Which signal do you trust more, the rich P/E or the discounted cash flow?
Look into how the SWS DCF model arrives at its fair value.
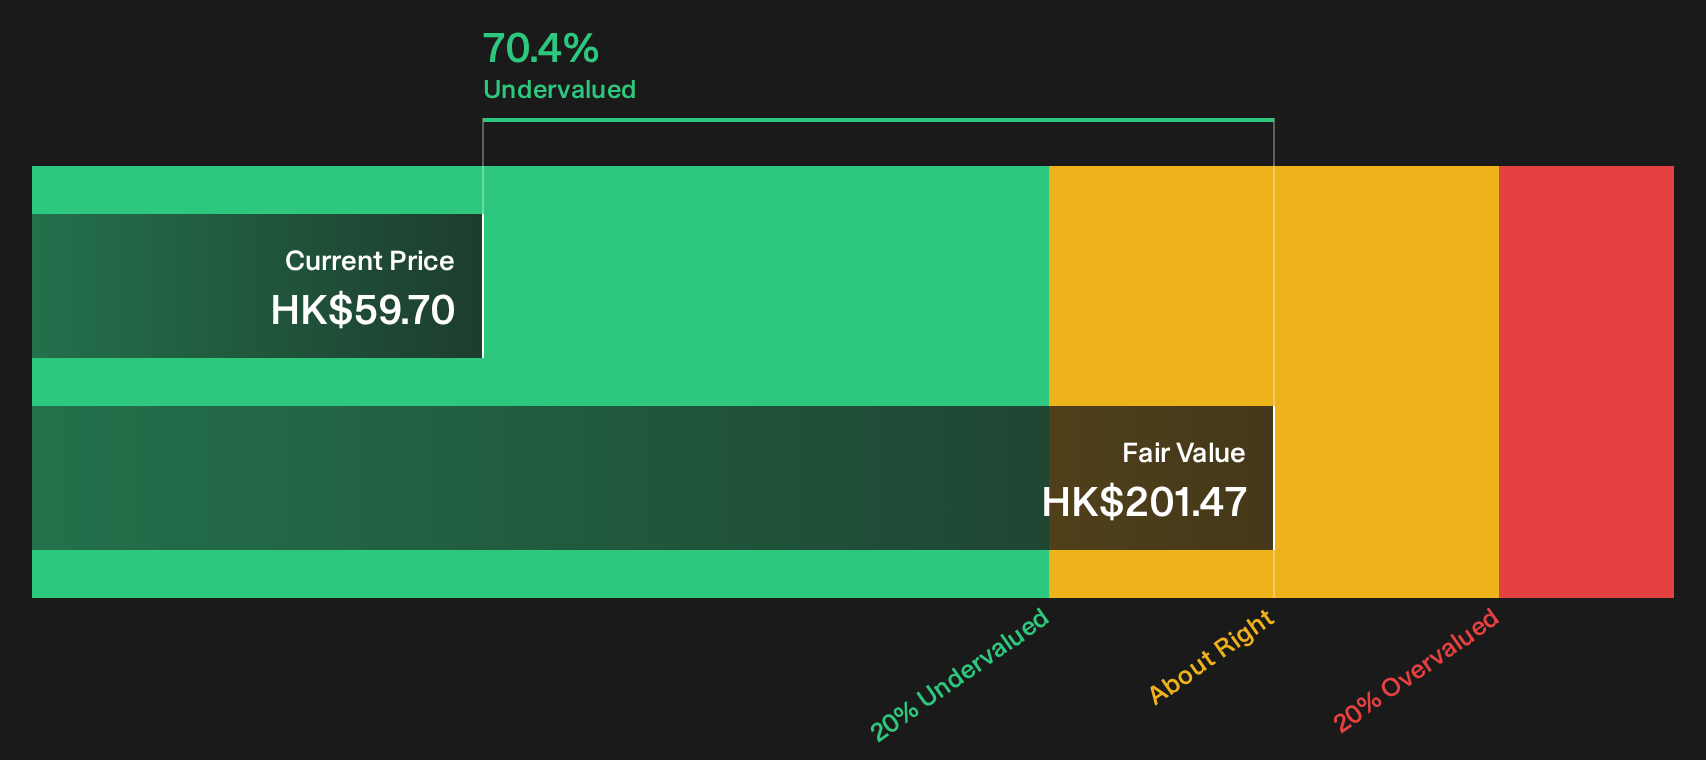
Simply Wall St performs a discounted cash flow (DCF) on every stock in the world every day (check out Shanghai Henlius Biotech for example). We show the entire calculation in full. You can track the result in your watchlist or portfolio and be alerted when this changes, or use our stock screener to discover 179 high quality undervalued stocks. If you save a screener we even alert you when new companies match - so you never miss a potential opportunity.
Next Steps
Sentiment on Shanghai Henlius Biotech is clearly split, with investors weighing both execution risks and potential upsides around HLX14 and the wider pipeline. To respond to that tension, review the full breakdown of 4 key rewards and 1 important warning sign
Looking for more investment ideas beyond Shanghai Henlius Biotech?
If you are weighing Shanghai Henlius Biotech, it makes sense to line it up against fresh ideas that match your risk tolerance and income goals.
- Target potential mispricings by running through a curated set of high quality value opportunities using the 179 high quality undervalued stocks.
- Prioritise resilience and capital protection by reviewing a focused group of 226 resilient stocks with low risk scores that may help steady your overall portfolio.
- Strengthen your income stream by scanning a concentrated field of yield focused plays through the 158 dividend fortresses.
This article by Simply Wall St is general in nature. We provide commentary based on historical data and analyst forecasts only using an unbiased methodology and our articles are not intended to be financial advice. It does not constitute a recommendation to buy or sell any stock, and does not take account of your objectives, or your financial situation. We aim to bring you long-term focused analysis driven by fundamental data. Note that our analysis may not factor in the latest price-sensitive company announcements or qualitative material. Simply Wall St has no position in any stocks mentioned.
Have feedback on this article? Concerned about the content? Get in touch with us directly. Alternatively, email editorial-team@simplywallst.com