
- PRICING
- LIVE QUOTES
- LEARN
- HELP


EN
Sterling Infrastructure (STRL) Climbed, But What Is Drawing Fresh Attention?
Sterling Infrastructure (STRL) moved into focus after recent research pointed to projections for both EPS and revenue ahead of its upcoming earnings release, sharpening attention on how expectations match reality.
Sterling Infrastructure’s latest 2.56% one-day share price gain to US$518.68 comes after several upbeat earnings previews. However, the 90-day share price return is down 39.82%, so recent momentum has cooled, even as the 62.51% year-to-date share price return and very large five-year total shareholder return indicate a strong longer-run story that investors are now reassessing against fresh expectations.
Spot 16 high quality undiscovered gems that share Sterling Infrastructure’s earnings momentum story yet still fly under most investors’ radar.Bulls point to Sterling Infrastructure’s growth forecasts and long-run returns, while bears focus on the sharp 90 day pullback and Hold ratings. Which side does today’s valuation actually support?
Most Popular Narrative: 41% Undervalued
Against Sterling Infrastructure’s last close at $518.68, the most followed narrative anchors fair value at about $876, framing today’s pullback as a valuation gap that hinges on how mega-project demand and margins hold up.
Current valuation appears to assume continued outsized E-Infrastructure revenue and margin growth, heavily reliant on unprecedented levels of data center construction and mega-project activity. If hyperscale data center CapEx or manufacturing mega-project awards slow due to macro or tech sector shifts, revenue and earnings could fall short of expectations.
See why 86 investors see Sterling Infrastructure as 41% undervalued.
Result: Fair Value of $876 (UNDERVALUED)
Still, the story breaks if mega-project demand or data center spending slows, or if project mix and cost inflation squeeze the expected margins at Sterling Infrastructure.
Find out about the key risks to this Sterling Infrastructure narrative.
Another View: Sterling Infrastructure Through the P/E Lens
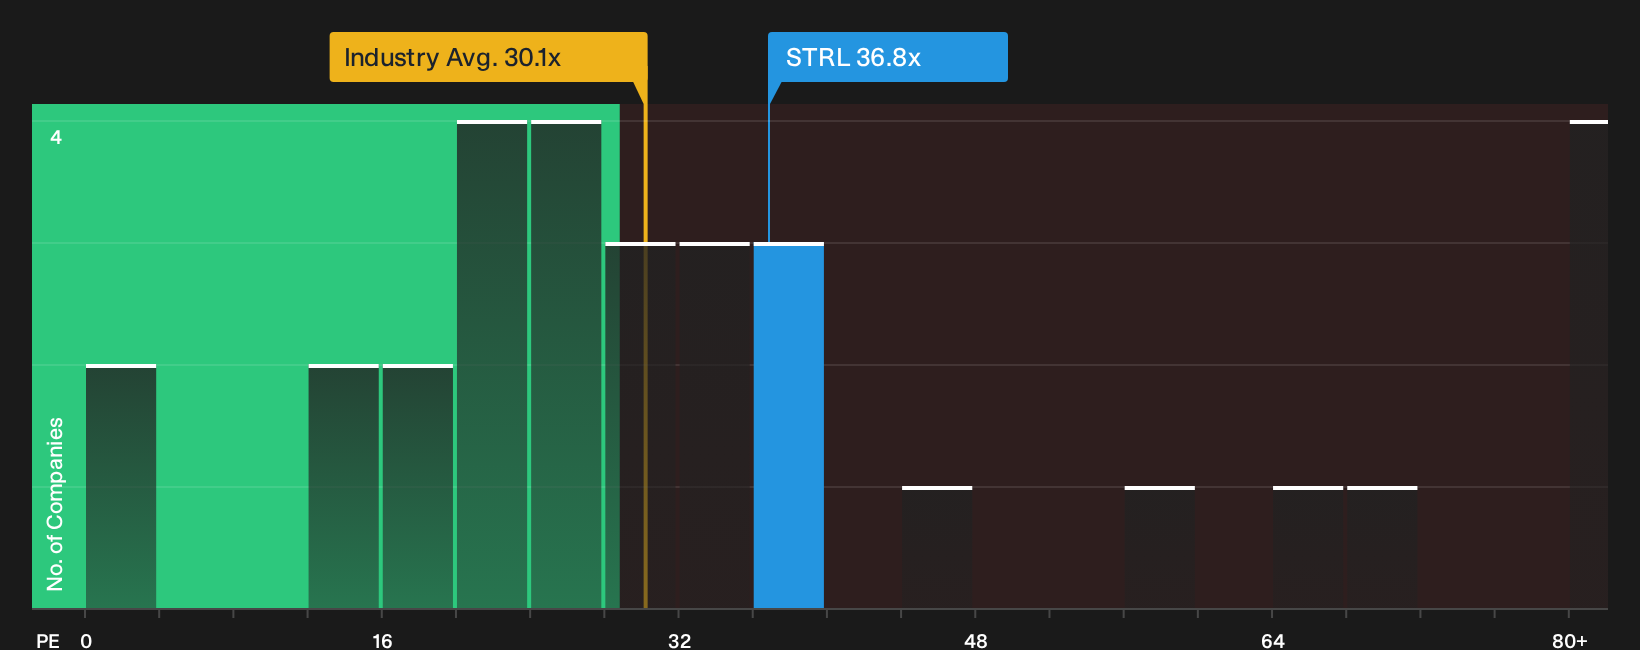
Look past the DCF-style fair value work and the picture shifts. Sterling Infrastructure trades on a P/E of 36.8x, which is higher than both the US Construction industry at 30.1x and the peer average at 28.1x, even though the fair ratio sits much higher at 63.7x.
That gap cuts both ways. A richer multiple than sector and peer groups suggests less room for error if growth or margins soften, while the fair ratio implies the valuation could still move closer to what the model flags over time. Which reference point do you think should carry more weight right now for Sterling Infrastructure?
See what the numbers say about this price — find out in our valuation breakdown.
Next Steps
Sentiment on Sterling Infrastructure is split, so move fast, review the full data set, and weigh the 4 key rewards and 2 important warning signs against your own expectations.
Looking for more Sterling Infrastructure style ideas?
If you stop with Sterling Infrastructure, you only see one angle. Broaden your watchlist with targeted stock ideas built from focused screener results while this earnings story unfolds.
- Target potential mispricings before the crowd notices by scanning our curated set of 33 high quality undervalued stocks.
- Prioritize resilience first and hunt for companies built on strong finances through the list of solid balance sheet and fundamentals (23 results).
- Dial down risk while still hunting for opportunity by zeroing in on 30 resilient stocks with low risk scores.
This article by Simply Wall St is general in nature. We provide commentary based on historical data and analyst forecasts only using an unbiased methodology and our articles are not intended to be financial advice. It does not constitute a recommendation to buy or sell any stock, and does not take account of your objectives, or your financial situation. We aim to bring you long-term focused analysis driven by fundamental data. Note that our analysis may not factor in the latest price-sensitive company announcements or qualitative material. Simply Wall St has no position in any stocks mentioned.
Have feedback on this article? Concerned about the content? Get in touch with us directly. Alternatively, email editorial-team@simplywallst.com