
- PRICING
- LIVE QUOTES
- LEARN
- HELP


EN
Metaplanet (TSE:3350) Could Be 8% Below Fair Value On Hong Kong Expansion
Metaplanet (TSE:3350) has drawn fresh attention after its board approved Metaplanet Asset Management Asia Limited in Hong Kong, a Bitcoin focused asset management hub that ties directly into the broader Project Nova build out.
For investors watching Metaplanet, the latest Hong Kong move drops into a mixed price story, with the share price up 11.47% over the past 30 days but down 48.08% on a year to date share price return and a 1 year total shareholder return that has fallen 60.03%. This comes even after a very large 3 year total shareholder return of about 11x, which highlights prior long term momentum, while short term enthusiasm has cooled.
Spot emerging Bitcoin focused financial platforms alongside Metaplanet by scanning our hand picked 18 cryptocurrency and blockchain stocks for companies tied to cryptocurrency and blockchain themes.Metaplanet is pushing ahead with Project Nova while the share price still reflects recent volatility. Does that combination suggest considering the Hong Kong expansion news now, or waiting for a calmer entry point before judging value?
Preferred Price-to-Sales of 26.5x: Is it justified for Metaplanet?
On simple sales-based metrics, Metaplanet does not look cheap. The stock trades on a P/S ratio of 26.5x, while peers in its comparison group trade around 1.2x, and the broader JP Hospitality industry sits near 0.9x.
The P/S multiple compares the value the market is placing on the equity to the revenue the business is generating. For Metaplanet, this means investors are paying ¥26.50 for every ¥1 of sales, compared with roughly ¥1 for competitors. That is a big gap for a company that is currently loss making, with reported net income of a ¥283,879 loss on ¥11,733 of revenue in the latest period.
Such a premium ratio suggests the market is already embedding a lot of expectation into Metaplanet, despite the business still being unprofitable and having a value score of 1 out of 6. The estimated fair P/S ratio of 2.1x also sits far below the current 26.5x level. This points to a valuation multiple that is much richer than the level regression analysis suggests the market could move toward over time.
Against that backdrop, the comparison with peers is stark. A 26.5x P/S versus 0.9x for the JP Hospitality industry and 1.2x for direct peers signals a valuation that is dramatically higher than both the sector and the implied fair ratio, even before factoring in the recent share price volatility and past shareholder dilution.
Explore the SWS fair ratio for Metaplanet.
Result: Price-to-Sales of 26.5x (OVERVALUED)
Still, the Metaplanet story carries clear pressure points, including ongoing net losses of ¥283,879 and heavy reliance on Bitcoin related revenue of ¥11,306 out of ¥11,733 total.
Find out about the key risks to this Metaplanet narrative.
Another View on Metaplanet’s Value
On the flip side of that rich 26.5x P/S ratio, our DCF model points to a fair value of about ¥264.71 per share versus the current ¥243. That implies Metaplanet trades roughly 8.2% below this estimate. Does a cash flow lens soften the concern around that premium sales multiple?
Look into how the SWS DCF model arrives at its fair value.
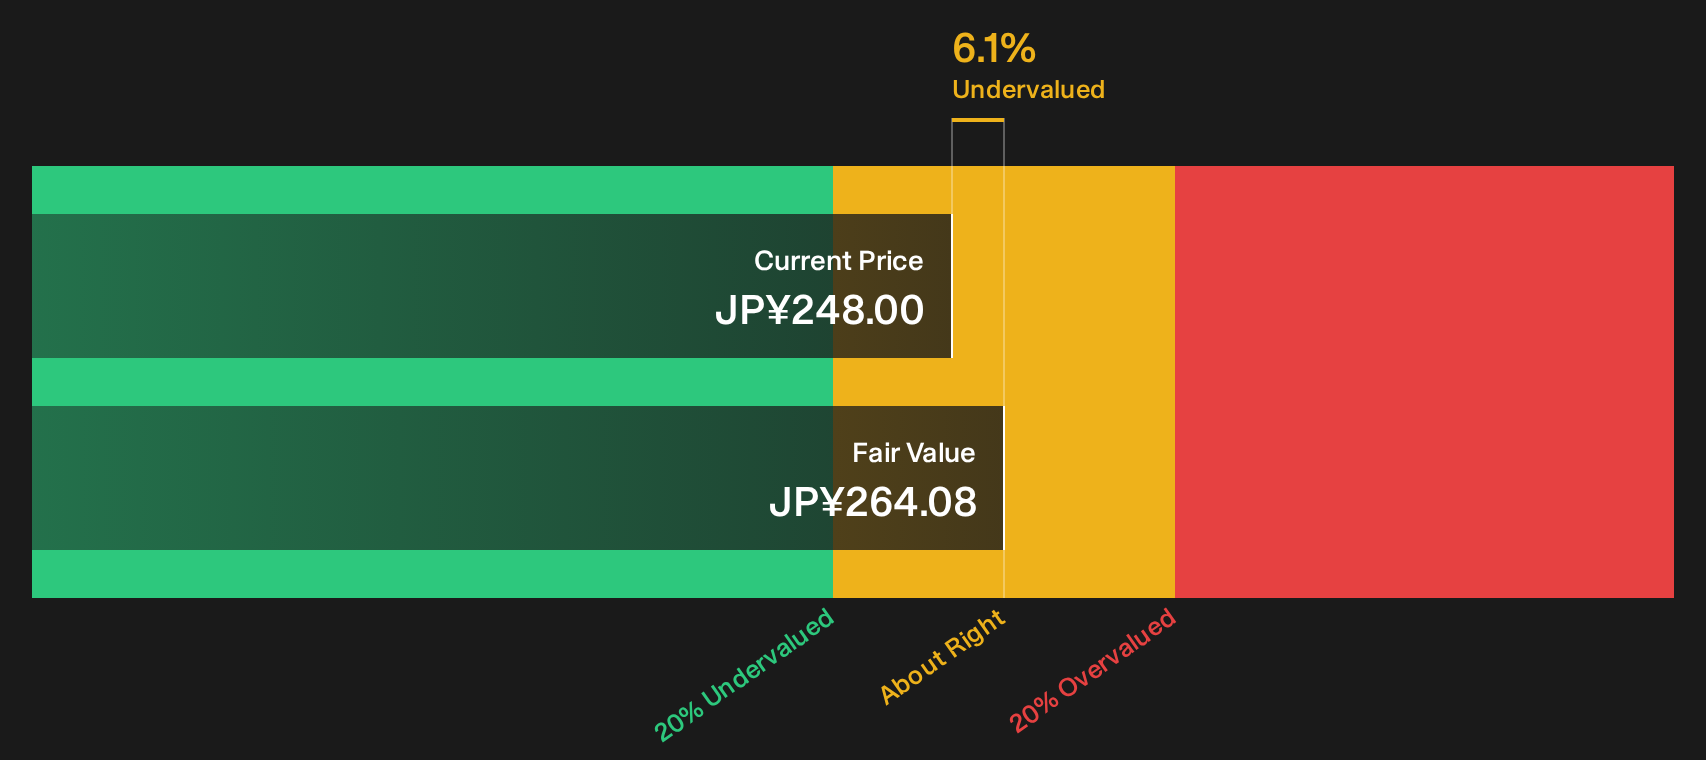
Simply Wall St performs a discounted cash flow (DCF) on every stock in the world every day (check out Metaplanet for example). We show the entire calculation in full. You can track the result in your watchlist or portfolio and be alerted when this changes, or use our stock screener to discover 17 high quality undervalued stocks. If you save a screener we even alert you when new companies match - so you never miss a potential opportunity.
Next Steps
Metaplanet’s mix of rich valuation metrics and Bitcoin heavy revenue can feel polarising, so treat this as a prompt to review the numbers yourself and move quickly while the data is fresh by weighing up the 2 key rewards and 2 important warning signs.
Looking for more Metaplanet sized ideas?
If Metaplanet has your attention, do not stop there. Broaden your watchlist with other clear setups that could complement or balance this kind of exposure.
- Target potential mispricing by scanning companies that screen as high quality and trading below estimated value through the 17 high quality undervalued stocks.
- Lock in more predictable cash flow ideas by reviewing a curated group of income opportunities via the 14 dividend fortresses.
- Reduce portfolio shocks by focusing on defensively positioned businesses with robust fundamentals inside the 21 resilient stocks with low risk scores.
This article by Simply Wall St is general in nature. We provide commentary based on historical data and analyst forecasts only using an unbiased methodology and our articles are not intended to be financial advice. It does not constitute a recommendation to buy or sell any stock, and does not take account of your objectives, or your financial situation. We aim to bring you long-term focused analysis driven by fundamental data. Note that our analysis may not factor in the latest price-sensitive company announcements or qualitative material. Simply Wall St has no position in any stocks mentioned.
Have feedback on this article? Concerned about the content? Get in touch with us directly. Alternatively, email editorial-team@simplywallst.com