
- PRICING
- LIVE QUOTES
- LEARN
- HELP


EN
Is First Busey (BUSE) Cheap On Its Shelf Registration Filing?
First Busey (BUSE) has filed an omnibus shelf registration covering common and preferred shares, debt securities, warrants, and several hybrid instruments, which gives the bank flexible tools to raise capital when conditions are suitable.
First Busey’s shelf registration comes after a strong run in the shares. The current share price is US$30.32 and the year-to-date share price return is 26.86%, while the 1-year total shareholder return of 27.52% and 3-year total shareholder return of 79.45% point to momentum that investors will be watching closely as the bank lines up new funding options.
Scan how First Busey’s capital plans compare with other banks setting up for potential moves by reviewing our carefully filtered list of solid balance sheet and fundamentals (23 results).
After a strong run that leaves First Busey at US$30.32, the gap between this price, analyst targets and intrinsic value estimates is wide enough to matter. So where does fair value really sit now?
Preferred Price-to-Earnings of 11.8x: Is it justified?
For First Busey, the valuation picture starts with a straightforward read on its P/E ratio. At 11.8x earnings, the stock is described as good value compared with a peer average of 13.7x, yet it is also flagged as expensive versus an estimated fair P/E of 10.7x.
The P/E multiple tells you what investors are currently paying for each dollar of profit. For a bank like First Busey, that lens matters because the business generates relatively steady earnings from lending, wealth management, and payment services rather than relying on highly speculative cash flows.
On one hand, trading below the 13.7x peer average suggests the market is not assigning a premium despite BUSE's earnings growth of 174.2% over the past year and net profit margin of 27.1%. On the other hand, the fair P/E estimate of 10.7x implies investors are paying more than the level that regression analysis suggests the market could move toward if sentiment cools, especially given a value score of 3 and a Return on Equity of 9.7% that is described as low.
Compared with the broader US Banks industry, the picture is more neutral. BUSE is described as expensive relative to the US Banks average because it trades at the same 11.8x P/E as the sector while also screening as above the 10.7x fair ratio level. That combination points to a valuation that is not stretched versus peers, yet still richer than what the fair multiple model indicates as a potential equilibrium.
Explore the SWS fair ratio for First Busey.
Result: Price-to-Earnings of 11.8x (ABOUT RIGHT)
Still, First Busey relies heavily on US banking conditions and credit quality. As a result, a weaker loan environment or rising funding costs could pressure those earnings multiples.
Find out about the key risks to this First Busey narrative.
Another View on First Busey’s Value
The P/E snapshot only tells part of the story for First Busey. Our DCF model points to a fair value estimate of US$50.38 per share, which is well above the current US$30.32 price. That kind of gap can signal mispricing, or it can signal optimistic cash flow assumptions. Which side of that line do you think this sits on?
Look into how the SWS DCF model arrives at its fair value.
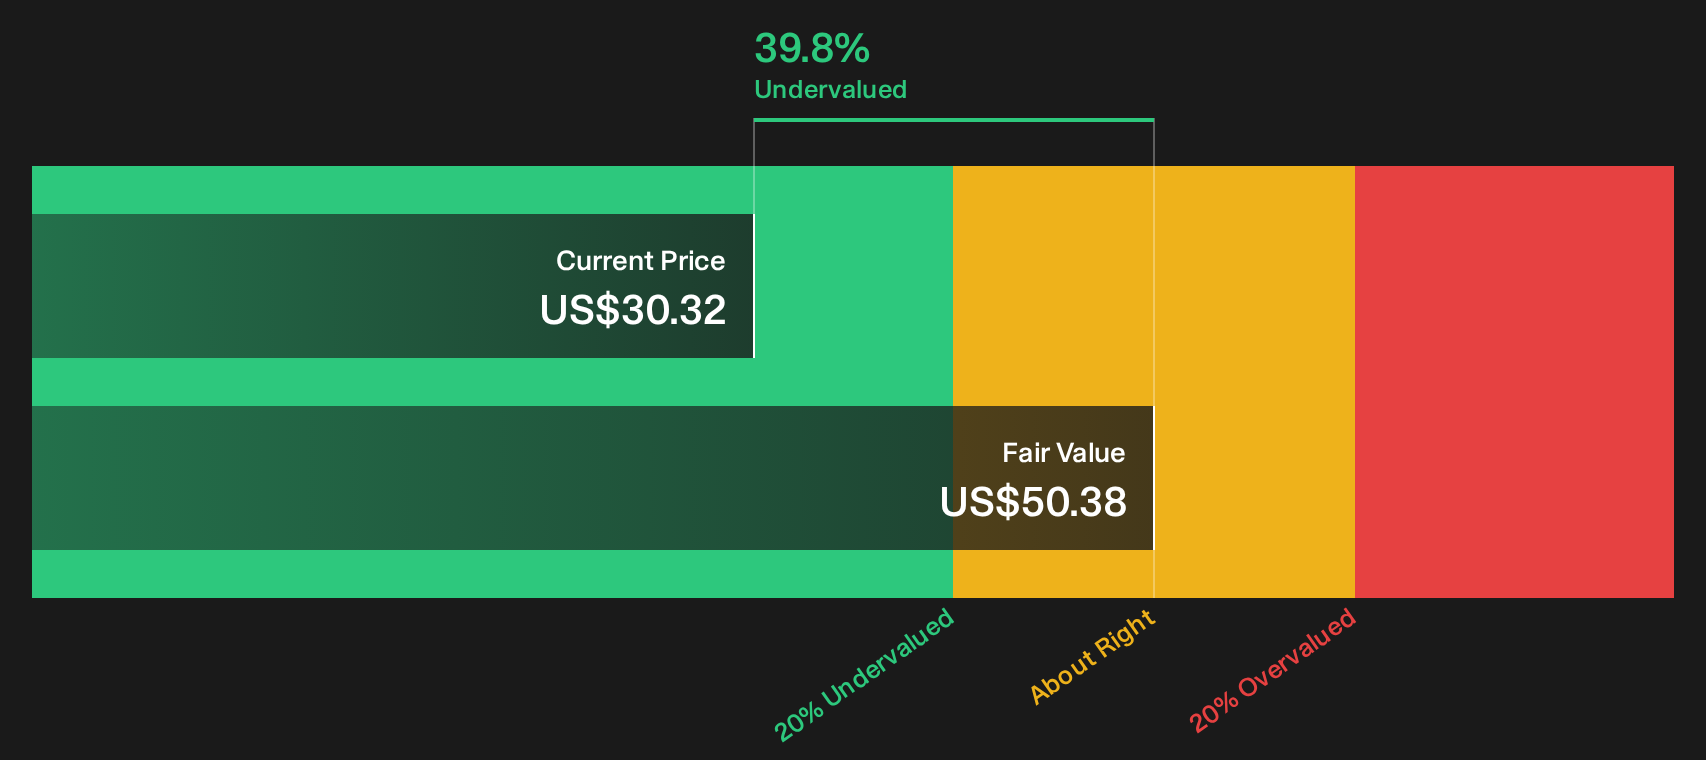
Simply Wall St performs a discounted cash flow (DCF) on every stock in the world every day (check out First Busey for example). We show the entire calculation in full. You can track the result in your watchlist or portfolio and be alerted when this changes, or use our stock screener to discover 33 high quality undervalued stocks. If you save a screener we even alert you when new companies match - so you never miss a potential opportunity.
Next Steps
If the tone of this First Busey review feels mixed, take that as a cue to move quickly and test the numbers yourself. Then pressure test the optimism by reviewing the 3 key rewards
Looking for more investment ideas beyond First Busey?
If this First Busey review sharpened your thinking, keep the momentum going by using focused stock lists that surface clear, data driven ideas in seconds.
- Target potential underpriced opportunities early and scan a curated set of 33 high quality undervalued stocks that pair quality fundamentals with attractive valuations.
- Strengthen income potential in your portfolio and compare stocks in our hand picked group of 6 dividend fortresses offering substantial yields with defensible payouts.
- Sleep easier during rough markets and concentrate on a 30 resilient stocks with low risk scores built around resilient balance sheets and lower risk scores.
This article by Simply Wall St is general in nature. We provide commentary based on historical data and analyst forecasts only using an unbiased methodology and our articles are not intended to be financial advice. It does not constitute a recommendation to buy or sell any stock, and does not take account of your objectives, or your financial situation. We aim to bring you long-term focused analysis driven by fundamental data. Note that our analysis may not factor in the latest price-sensitive company announcements or qualitative material. Simply Wall St has no position in any stocks mentioned.
Have feedback on this article? Concerned about the content? Get in touch with us directly. Alternatively, email editorial-team@simplywallst.com