
- PRICING
- LIVE QUOTES
- LEARN
- HELP


EN
JEOL (TSE:6951) Climbed Again, So What Is Catching Investors' Attention?
JEOL (TSE:6951) has drawn fresh attention after recent trading left the share price at ¥7,263, with year to date and 1 year total returns of 44.3% and 52.0% respectively.
Recent trading suggests that momentum in JEOL is still building, with a 7-day share price return of 5.95% and a year-to-date share price return of 44.25%. The 1-year total shareholder return of 51.99% points to both price gains and dividends contributing to overall performance.
Scan other fast-moving opportunities alongside JEOL by reviewing the hand-picked 95 robotics and automation stocks that are also riding investor interest in advanced equipment and automation.
JEOL now trades with a strong recent track record and upbeat analyst targets, which raises a simple tension. Are buyers responding to sturdier earnings and revenue trends, or has sentiment run ahead of what the valuation supports?
Price-to-Earnings of 22.5x: Is it justified?
On current numbers, JEOL trades on a P/E of 22.5x, which places the ¥7,263 share price at a richer level than some valuation checks support.
The P/E ratio compares what investors pay today for each unit of earnings, so it captures how much optimism is being built into future profit power for a business like JEOL that sells high spec scientific, industrial, and medical equipment.
Analysts view the stock as good value when stacked against direct peers on a similar multiple. However, the same P/E of 22.5x screens as expensive against both the JP Electronic industry average of 15.7x and an estimated fair P/E of 21.8x that our fair ratio work suggests the market could move toward over time.
Explore the SWS fair ratio for JEOL.
Result: Price-to-Earnings of 22.5x (OVERVALUED)
Still, JEOL faces clear risks if demand for high end scientific tools softens or if global capital spending in electronics and healthcare equipment slows materially.
Find out about the key risks to this JEOL narrative.
Another View on JEOL using cash flows
Price based ratios point to a rich tag for JEOL, yet the SWS DCF model is even harsher. It puts future cash flow value at ¥3,580.3 per share against a market price of ¥7,263, which presents the stock as overvalued on this lens and leaves you asking which signal deserves more weight.
Look into how the SWS DCF model arrives at its fair value.
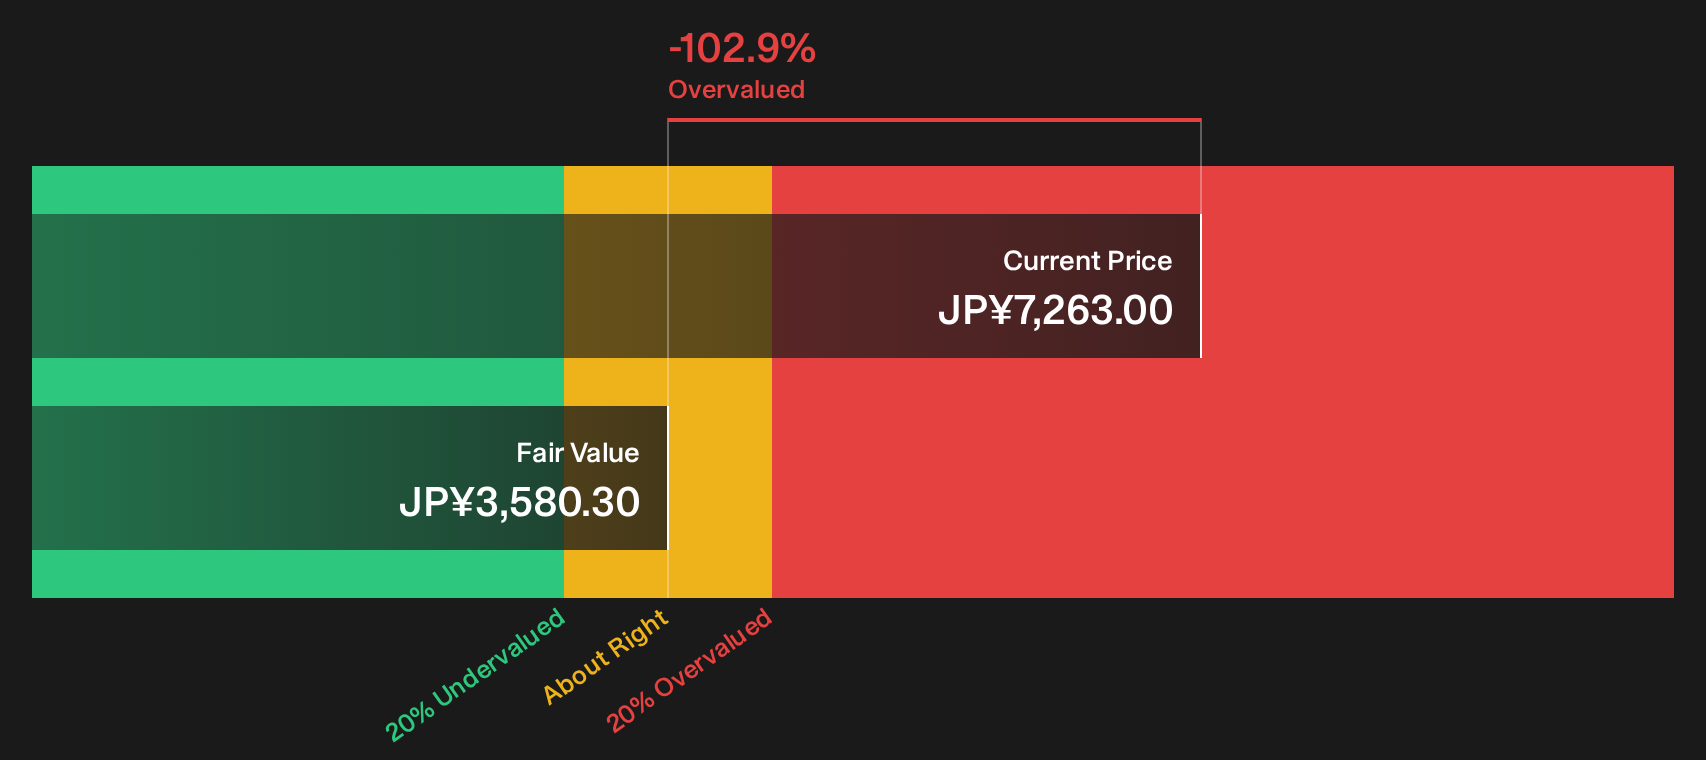
Simply Wall St performs a discounted cash flow (DCF) on every stock in the world every day (check out JEOL for example). We show the entire calculation in full. You can track the result in your watchlist or portfolio and be alerted when this changes, or use our stock screener to discover 17 high quality undervalued stocks. If you save a screener we even alert you when new companies match - so you never miss a potential opportunity.
Next Steps
If the mix of overvaluation flags and growth hopes around JEOL feels finely balanced, consider acting promptly and weighing the trade off yourself by checking the 1 key reward and 2 important warning signs.
Looking for more ideas beyond JEOL?
If JEOL has sharpened your interest, do not stop here. Cast the net wider and let data driven tools surface fresh, high conviction possibilities.
- Hunt for mispriced quality and see which companies line up in the 17 high quality undervalued stocks before the crowd catches on.
- Build a steadier income stream and use the 14 dividend fortresses to focus on higher yielding payers with stronger staying power.
- Prioritize resilience first and scan the 21 resilient stocks with low risk scores to find businesses with quieter price swings and sturdier profiles.
This article by Simply Wall St is general in nature. We provide commentary based on historical data and analyst forecasts only using an unbiased methodology and our articles are not intended to be financial advice. It does not constitute a recommendation to buy or sell any stock, and does not take account of your objectives, or your financial situation. We aim to bring you long-term focused analysis driven by fundamental data. Note that our analysis may not factor in the latest price-sensitive company announcements or qualitative material. Simply Wall St has no position in any stocks mentioned.
Have feedback on this article? Concerned about the content? Get in touch with us directly. Alternatively, email editorial-team@simplywallst.com