
- PRICING
- LIVE QUOTES
- LEARN
- HELP


EN
Is ICL Group (ICL) Undervalued As Its Earnings Upgrade Lifts Expectations?
ICL Group (NYSE:ICL) is back on radars after a recent upgrade to a stronger Zacks rank, driven by higher earnings estimates that point to improved expectations and fresh scrutiny of the stock.
Recent trading tells a mixed story for ICL Group. The US$5.53 share price follows a 7.59% return over the past 90 days, while the 1-year total shareholder return is down 7.18%. This suggests that recent momentum is improving from a weaker longer-term base as the earnings upgrade renews interest in the stock.
Compare this ICL Group upgrade with peers experiencing similar estimate momentum by scanning our hand picked list of 29 high quality undervalued stocks.
ICL Group now trades at a discount to both one estimate of fair value and to analyst targets after a modest rebound. Is the stock mispriced, or is the market simply treating recent optimism with justified caution?
Price-to-Earnings of 23.4x: Is it justified for ICL Group?
ICL Group screens as inexpensive against one DCF based estimate of fair value, yet the stock carries a P/E of 23.4x that is slightly richer than both the US Chemicals industry average of 23.2x and a peer group on 22.3x. That mix of discount on cash flow and premium on earnings is what investors now need to weigh against the recent upgrade.
The P/E ratio compares what you pay per share to the earnings that ICL Group generates per share. For a diversified minerals and chemicals producer with segments spanning Industrial Products, Potash, Phosphate Solutions and Growing Solutions, this metric gives a quick read on how the market prices current profitability from its US$7.7b in annual revenue and US$305m in net income.
A P/E above sector and peer averages often signals that the market is assigning a richer tag to each dollar of profit. In this case, the 23.4x multiple, coupled with statements pointing to declining earnings over the past five years and lower net profit margins compared with last year, suggests investors are paying more than the typical Chemicals stock for a business that has not shown recent profit expansion. That raises a simple question for holders: Is that premium mainly about the breadth of ICL Group's product set and customer industries, or is it optimism that may not yet be backed by the earnings track record?
Relative comparisons tighten this lens. Management's own assessment shows ICL Group as expensive when stacked against both the broader US Chemicals industry at 23.2x P/E and a peer group average of 22.3x. The valuation screen also flags a low overall value score of 2 out of 6, even though the stock trades around 36.6% below one estimate of fair value and below a future cash flow estimate of US$8.73 per share from the SWS DCF model. That combination tells investors the market price embeds a richer earnings tag than peers, while one cash flow based framework still sees a considerable gap to intrinsic worth.
See what the numbers say about this price — find out in our valuation breakdown.
Result: Price-to-Earnings of 23.4x (OVERVALUED)
Still, the weaker 1 year and 5 year total returns, together with a low value score of 2 out of 6, could cap enthusiasm for ICL Group.
Find out about the key risks to this ICL Group narrative.
Another View on ICL Group's Value
The P/E discussion presents ICL Group as expensive, yet the SWS DCF model suggests the opposite. On that cash flow view, the shares trade around 36.6% below an estimated value of US$8.73 per share, which frames the current US$5.53 price as potentially discounted rather than stretched.
The contrast between an earnings-based premium and a cash-flow-based discount leaves investors with a straightforward question. Is the higher P/E a warning that cash flow assumptions may be too generous, or is the DCF indicating possible upside that short-term profit pressure is obscuring?
Look into how the SWS DCF model arrives at its fair value.
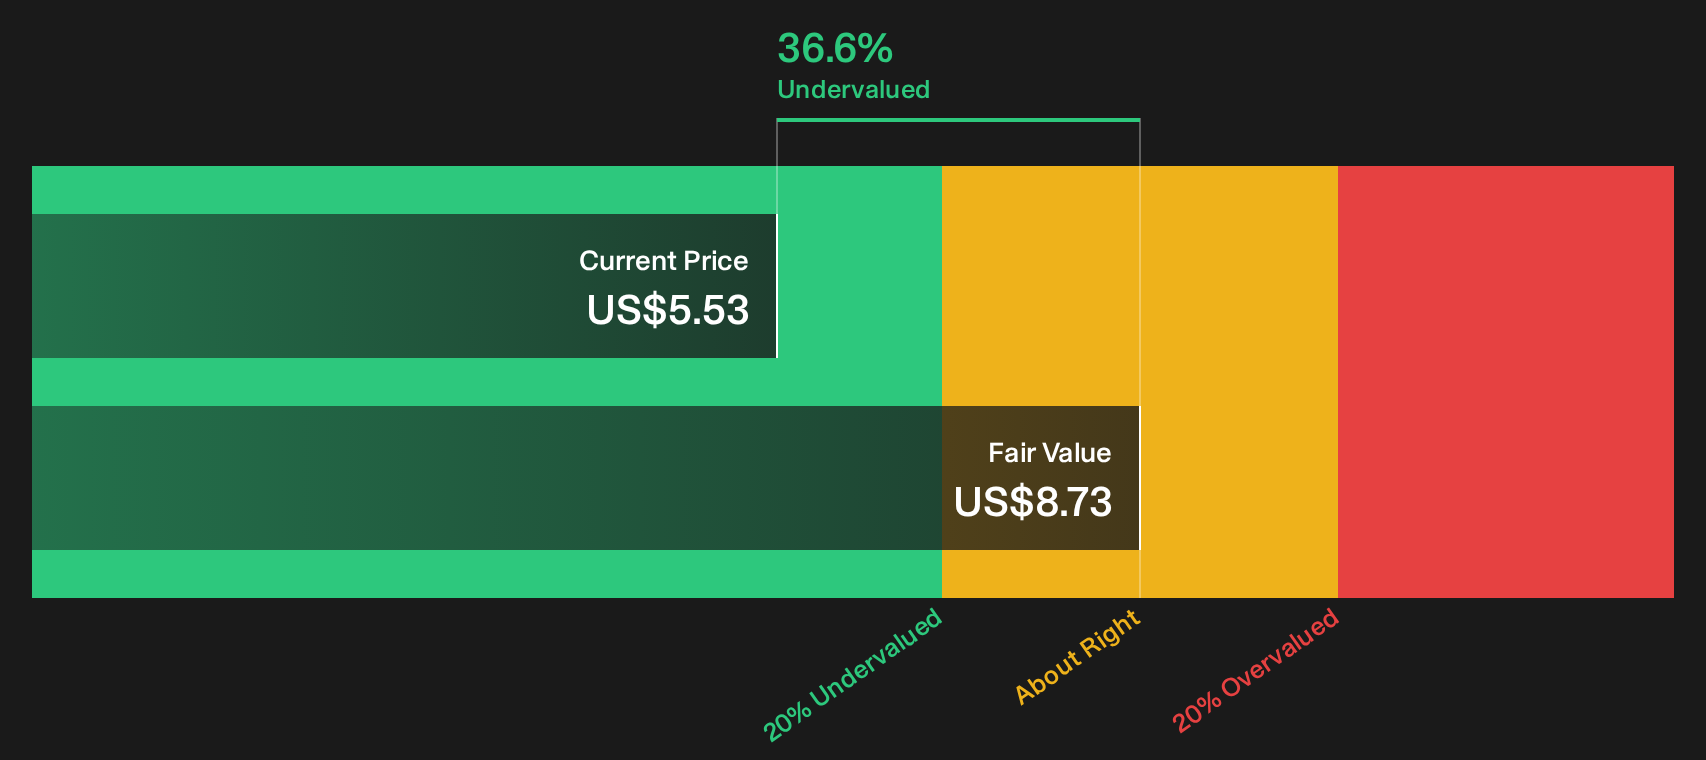
Simply Wall St performs a discounted cash flow (DCF) on every stock in the world every day (check out ICL Group for example). We show the entire calculation in full. You can track the result in your watchlist or portfolio and be alerted when this changes, or use our stock screener to discover 29 high quality undervalued stocks. If you save a screener we even alert you when new companies match - so you never miss a potential opportunity.
Next Steps
Mixed signals on ICL Group's valuation and sentiment can look confusing at first glance, so move quickly to review the underlying numbers, weigh the earnings and cash flow stories, and stress test both the risks and potential upside by digging into the 1 key reward and 4 important warning signs.
Looking for more investment ideas beyond ICL Group?
If ICL Group has sharpened your focus on valuation and risk, then broadening your watchlist now can help you spot opportunities before they move.
- Target potential value opportunities early by scanning the 29 high quality undervalued stocks that combine quality fundamentals with discounted prices.
- Prioritize resilience and sleep better at night by reviewing the 30 resilient stocks with low risk scores designed to spotlight businesses with more measured risk profiles.
- Hunt for future leaders before the crowd notices by tracking the 16 high quality undiscovered gems that pair solid numbers with limited market attention.
This article by Simply Wall St is general in nature. We provide commentary based on historical data and analyst forecasts only using an unbiased methodology and our articles are not intended to be financial advice. It does not constitute a recommendation to buy or sell any stock, and does not take account of your objectives, or your financial situation. We aim to bring you long-term focused analysis driven by fundamental data. Note that our analysis may not factor in the latest price-sensitive company announcements or qualitative material. Simply Wall St has no position in any stocks mentioned.
Have feedback on this article? Concerned about the content? Get in touch with us directly. Alternatively, email editorial-team@simplywallst.com