
- PRICING
- LIVE QUOTES
- LEARN
- HELP


EN
Murata Manufacturing (TSE:6981) Gains On Earnings Upgrades, But Is The Valuation Already Priced In?
Murata Manufacturing (TSE:6981) is back on investor radars after analysts lifted their consensus earnings estimates for the next quarter and full year. This move coincides with a strengthened third party ranking.
The recent analyst revisions arrive after a sharp reset in sentiment. Murata Manufacturing’s share price has a 1-day return of 4.47% and a 7-day return of 5.59%, while the 90-day share price return declined 33.93%. At the same time, the year-to-date move is 133.12% and the 1-year total shareholder return is 203.95%, which together indicate that longer term momentum has been rebuilding following a deep pullback.
Scan analyst-backed momentum stories like Murata Manufacturing alongside a hand-picked 17 high quality undervalued stocks that combine earnings upgrades with balance sheet strength.
For Murata Manufacturing, the jump in sentiment could be investors chasing a narrative, or it could be the market catching up with the underlying business. The valuation is where that tension really shows up.
Price-to-Earnings of 53.2x: Is it justified?
On simple valuation math, Murata Manufacturing trades on a P/E of 53.2x, which puts a rich tag on the current ¥7,763 share price compared with many peers.
The P/E ratio compares what investors are paying today for each unit of current earnings. For a business like Murata Manufacturing, which supplies passive electronic components into communications, mobility, data center and consumer devices, that figure often reflects how much investors are willing to pay for expected profit growth and earnings quality.
Murata Manufacturing carries a high quality earnings profile and analysts expect earnings to grow 25.7% per year, which can help explain why the market is willing to tolerate a 53.2x P/E. At the same time, internal modelling flags that this P/E is expensive relative to an estimated fair P/E of 35.9x. This is a level the market could move toward if sentiment cools. The share price is also described as trading at a 33.1% discount to an estimate of future cash flow value of ¥11,603.75, so some investors may see the premium P/E as a trade off against that cash flow based upside.
Compared with the JP Electronic industry average P/E of 15.7x and a peer average of 49.5x, Murata Manufacturing is priced at a clear premium. That stretch in valuation suggests investors are paying extra for its growth forecasts and return profile, and leaves less room for disappointment if those expectations are not met.
Explore the SWS fair ratio for Murata Manufacturing.
Result: Price-to-Earnings of 53.2x (OVERVALUED)
Still, the rich P/E on Murata Manufacturing could be exposed if earnings forecasts are revised lower or if demand softens across key electronics end markets.
Find out about the key risks to this Murata Manufacturing narrative.
Another view on Murata Manufacturing’s value
While the 53.2x P/E flags a rich tag for Murata Manufacturing, the SWS DCF model points in the opposite direction. On that framework, the current ¥7,763 price sits about 33.1% below an estimated future cash flow value of ¥11,603.75, which frames the stock as undervalued instead of stretched.
That kind of gap can cut both ways. It may signal opportunity if cash flows come through as modelled, or it may highlight how sensitive any fair value figure is to long term assumptions. Which signal do you trust more when they disagree this clearly?
Look into how the SWS DCF model arrives at its fair value.
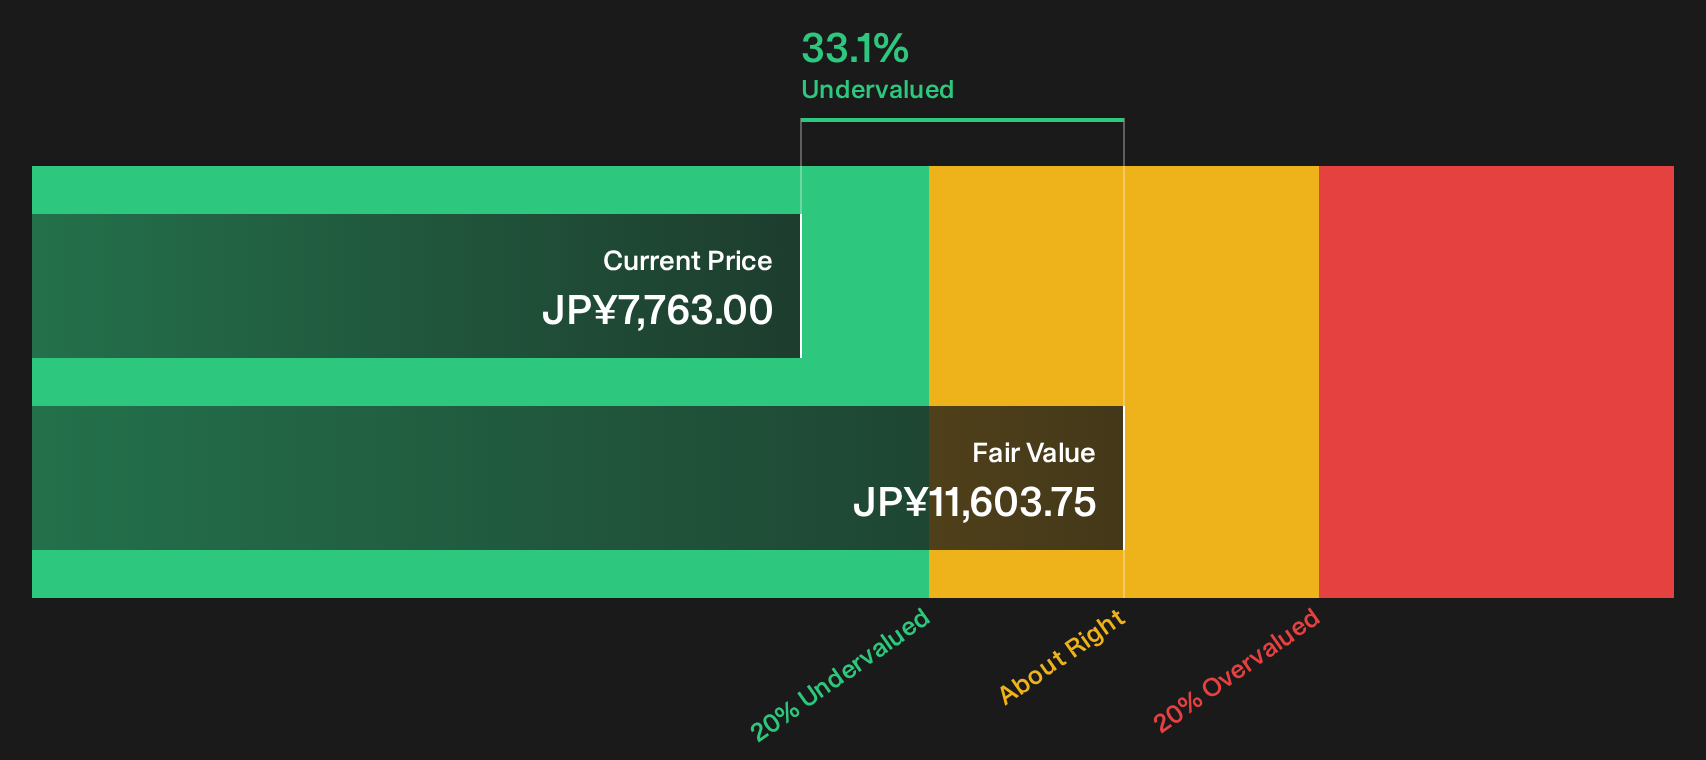
Simply Wall St performs a discounted cash flow (DCF) on every stock in the world every day (check out Murata Manufacturing for example). We show the entire calculation in full. You can track the result in your watchlist or portfolio and be alerted when this changes, or use our stock screener to discover 17 high quality undervalued stocks. If you save a screener we even alert you when new companies match - so you never miss a potential opportunity.
Next Steps
Mixed signals around Murata Manufacturing’s valuation and sentiment can feel noisy, so move fast, sift through the data, and weigh both sides of the story. To sharpen that view and see how the risks balance against the potential upside, review the 2 key rewards and 1 important warning sign
Looking for more ideas beyond Murata Manufacturing?
Do not stop at one opportunity. Broaden the watchlist and let data driven filters surface stocks that better match personal risk, return, and income goals.
- Target potential upside early by scanning a focused pool of smaller companies through the 1 elite penny stocks with strong financials.
- Prioritise quality at a reasonable price by filtering for strong fundamentals and attractive pricing using the 17 high quality undervalued stocks.
- Strengthen portfolio resilience with companies that pair financial stability and solid metrics via the list of solid balance sheet and fundamentals (20 results).
This article by Simply Wall St is general in nature. We provide commentary based on historical data and analyst forecasts only using an unbiased methodology and our articles are not intended to be financial advice. It does not constitute a recommendation to buy or sell any stock, and does not take account of your objectives, or your financial situation. We aim to bring you long-term focused analysis driven by fundamental data. Note that our analysis may not factor in the latest price-sensitive company announcements or qualitative material. Simply Wall St has no position in any stocks mentioned.
Have feedback on this article? Concerned about the content? Get in touch with us directly. Alternatively, email editorial-team@simplywallst.com