
- PRICING
- LIVE QUOTES
- LEARN
- HELP


EN
Trump Media & Technology Group (DJT) Following $5,000 Dividend Talk Still Looks Pricey
Trump Media & Technology Group (DJT) is back in focus after renewed concern about its perceived overvaluation and fresh uncertainty tied to former President Trump’s proposed US$5,000 dividend for U.S. citizens.
At a latest share price of US$8.68, Trump Media & Technology Group has seen a 30 day share price return of 7.69%, although the year to date share price return is down 36.96% and the 1 year total shareholder return has declined 48.73%. This suggests recent momentum is building off a much weaker longer term track record as investors react to concerns about valuation and the implications of the proposed US$5,000 citizen dividend on perceived risk.
Balance the drama around Trump Media & Technology Group by scanning a curated 30 resilient stocks with low risk scores, which may offer a calmer ride than this headline driven stock.
Bulls see Trump Media & Technology Group as a rare political brand with optionality, while bears point to losses and a rich market value. Which side does the current valuation actually support?
Preferred Price-to-Book of 2.4x for Trump Media & Technology Group: Is it justified?
On Simply Wall St’s checks, Trump Media & Technology Group trades on a P/B of 2.4x in the context of an $8.68 share price and an estimated future cash flow value of $1.39 per share, which suggests investors are paying a steep premium to both assets and the SWS DCF model.
P/B compares the market value of the equity to the net assets on the balance sheet, so a 2.4x level means the market is valuing DJT at a little over two times its book value. For a media and social platform business that is currently loss making and reports only about $5m of revenue, that kind of multiple leans heavily on expectations about future monetisation rather than current fundamentals.
That tension shows up clearly in the cross checks. Simply Wall St’s DCF model, which projects future cash flows and discounts them back to today, arrives at a future cash flow value of $1.39 per share while the stock trades at $8.68. The platform also flags that DJT is expensive versus the broader US Interactive Media and Services industry P/B average of 1x, yet screens as cheaper than a narrower peer group on P/B, where the average is 3.4x. Investors are therefore paying more than the sector, but less than closer comparables.
See what the numbers say about this price — find out in our valuation breakdown.
Result: Price-to-book of 2.4x (OVERVALUED).
Still, the narrative around Trump Media & Technology Group could quickly be challenged if losses persist or if the proposed US$5,000 citizen dividend faces meaningful pushback.
Find out about the key risks to this Trump Media & Technology Group narrative.
Another View on Trump Media & Technology Group’s Value
The earlier check on Trump Media & Technology Group used its 2.4x P/B ratio and pointed to a rich price. Our DCF model also comes out cautious, since the share price of $8.68 sits well above an estimated future cash flow value of $1.39 per share. Is this simply brand premium, or a gap that eventually has to close?
Look into how the SWS DCF model arrives at its fair value.
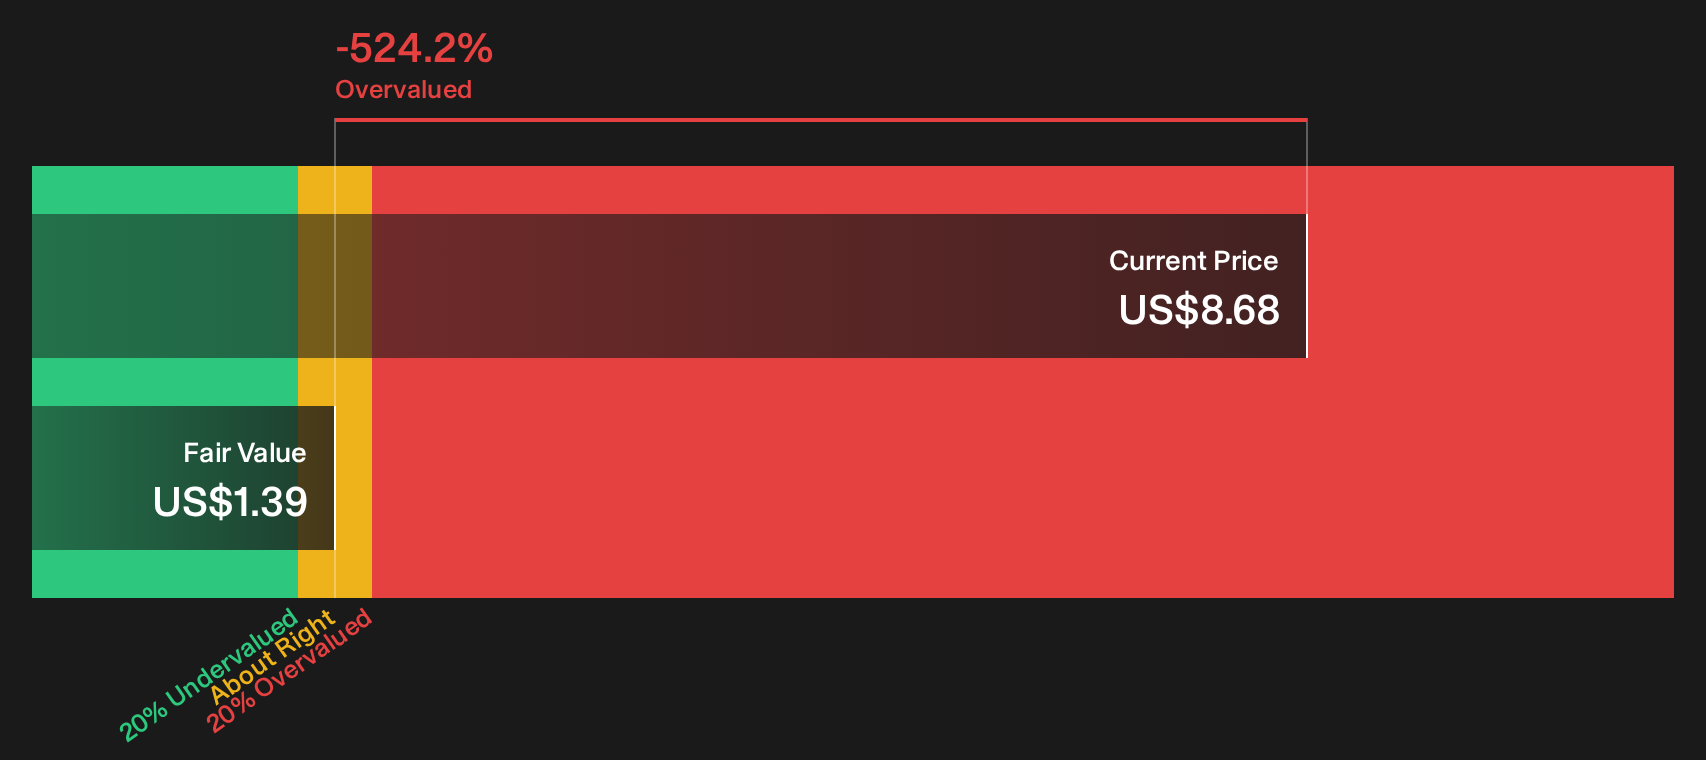
Simply Wall St performs a discounted cash flow (DCF) on every stock in the world every day (check out Trump Media & Technology Group for example). We show the entire calculation in full. You can track the result in your watchlist or portfolio and be alerted when this changes, or use our stock screener to discover 29 high quality undervalued stocks. If you save a screener we even alert you when new companies match - so you never miss a potential opportunity.
Next Steps
Concerned the tone around Trump Media & Technology Group is either too bullish or too pessimistic? Review the underlying data, examine the assumptions, and compare them with the 2 important warning signs.
Looking for more Trump Media & Technology Group sized ideas?
Do not stop your research with Trump Media & Technology Group. A few minutes in the Simply Wall St screener can surface very different risk and reward profiles.
- Target stability and sleep better at night by scanning a list of solid balance sheet and fundamentals (23 results) that can handle rough markets and unexpected shocks.
- Hunt for quality at a discount by reviewing a 29 high quality undervalued stocks that combines strong fundamentals with prices that still look reasonable.
- Boost potential portfolio income by checking a 6 dividend fortresses that focuses on companies offering higher yields with the numbers to back them up.
This article by Simply Wall St is general in nature. We provide commentary based on historical data and analyst forecasts only using an unbiased methodology and our articles are not intended to be financial advice. It does not constitute a recommendation to buy or sell any stock, and does not take account of your objectives, or your financial situation. We aim to bring you long-term focused analysis driven by fundamental data. Note that our analysis may not factor in the latest price-sensitive company announcements or qualitative material. Simply Wall St has no position in any stocks mentioned.
Have feedback on this article? Concerned about the content? Get in touch with us directly. Alternatively, email editorial-team@simplywallst.com