
- PRICING
- LIVE QUOTES
- LEARN
- HELP


EN
Global Market Insights: 3 Stocks That May Be Trading At A Discount
In recent weeks, global markets have faced heightened volatility due to escalating geopolitical tensions and rising energy prices, leading to inflation concerns and upward pressure on bond yields. Amidst these challenges, investors may find opportunities in stocks that appear undervalued relative to their intrinsic value or growth potential. Identifying such stocks requires careful consideration of market conditions and a company's fundamentals.
Top 10 Undervalued Stocks Based On Cash Flows
| Name | Current Price | Fair Value (Est) | Discount (Est) |
| Rakus (TSE:3923) | ¥1080.50 | ¥2068.70 | 47.8% |
| PAL GROUP Holdings (TSE:2726) | ¥1486.00 | ¥2878.97 | 48.4% |
| Monde Nissin (PSE:MONDE) | ₱6.41 | ₱12.68 | 49.5% |
| KSB SE KGaA (XTRA:KSB) | €904.00 | €1763.78 | 48.7% |
| Koninklijke BAM Groep (ENXTAM:BAMNB) | €11.75 | €23.11 | 49.1% |
| Dongwon Industries (KOSE:A006040) | ₩35750.00 | ₩70676.36 | 49.4% |
| CombinedX (OM:CX) | SEK39.50 | SEK78.43 | 49.6% |
| Cheil Worldwide (KOSE:A030000) | ₩17350.00 | ₩34052.83 | 49% |
| Apator (WSE:APT) | PLN25.50 | PLN49.08 | 48% |
| AK Medical Holdings (SEHK:1789) | HK$4.84 | HK$9.58 | 49.5% |
Here's a peek at a few of the choices from the screener.
Sichuan Teway Food GroupLtd (SHSE:603317)
Overview: Sichuan Teway Food Group Co., Ltd, with a market cap of CN¥13.19 billion, is involved in the research, development, production, and sale of compound seasonings in China.
Operations: The company generates revenue from its core activities, which include the research, development, production, and sale of compound seasonings within China.
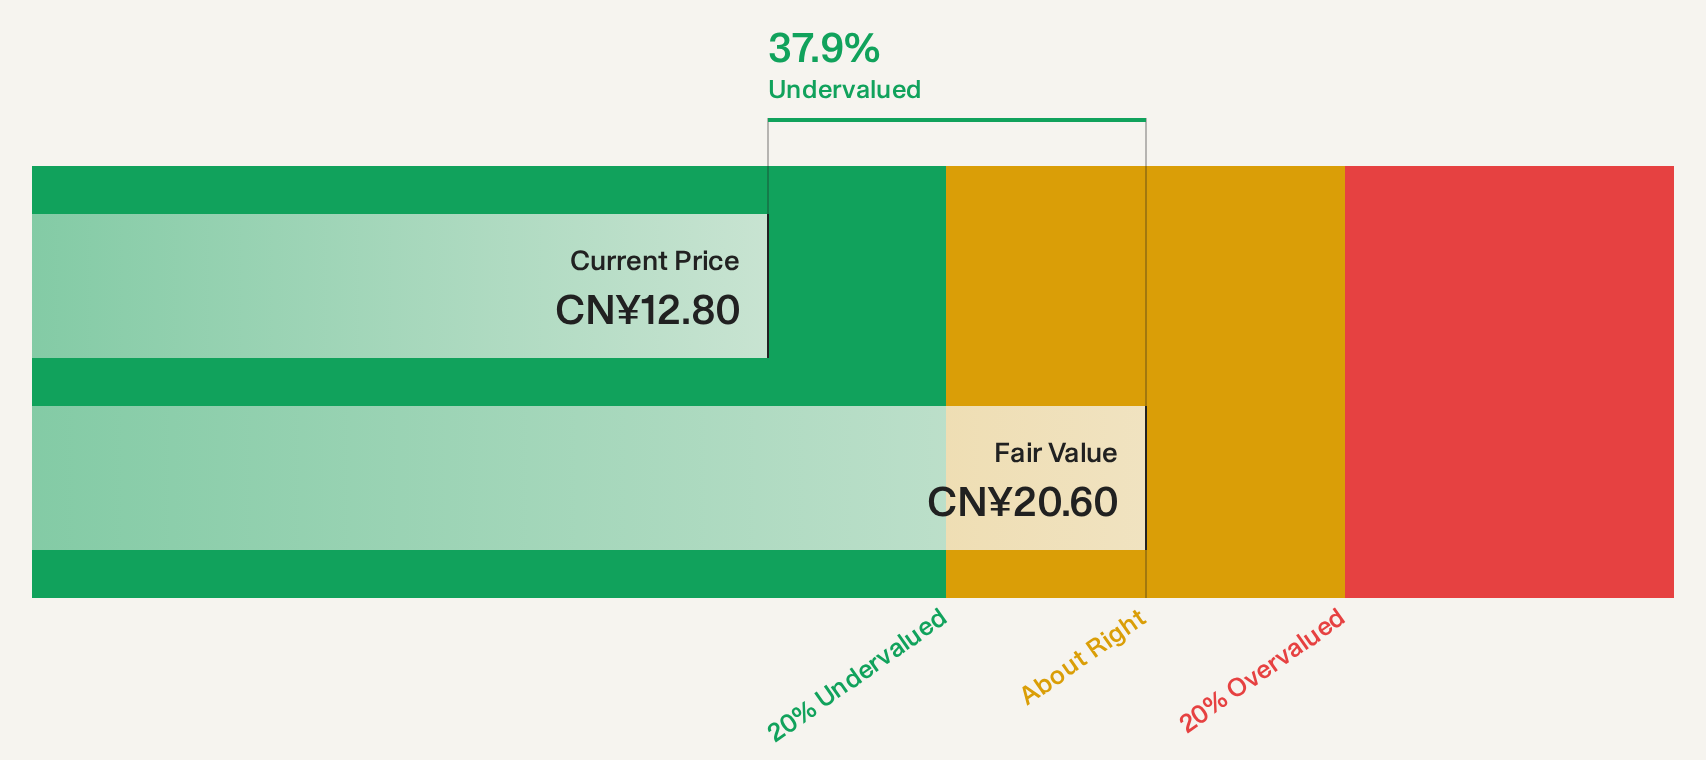
Estimated Discount To Fair Value: 37.7%
Sichuan Teway Food Group Ltd. appears undervalued based on cash flows, trading at CN¥12.83, below its estimated future cash flow value of CN¥20.6. Recent earnings results for H1 2026 showed significant growth, with net income reaching CNY 380.8 million, doubling from the previous year. Despite a slower forecasted revenue growth rate of 6.5% per year compared to the Chinese market average of 17.3%, it trades at a good relative value among peers and industry benchmarks.
- In light of our recent growth report, it seems possible that Sichuan Teway Food GroupLtd's financial performance will exceed current levels.
- Delve into the full analysis health report here for a deeper understanding of Sichuan Teway Food GroupLtd.
Toenec (TSE:1946)
Overview: Toenec Corporation is involved in facility construction work in Japan and has a market cap of ¥209.74 billion.
Operations: The company's revenue is primarily derived from the Equipment Installation Business, excluding Energy Business, which generates ¥255.31 billion, and the Energy Business itself, contributing ¥12.48 billion.
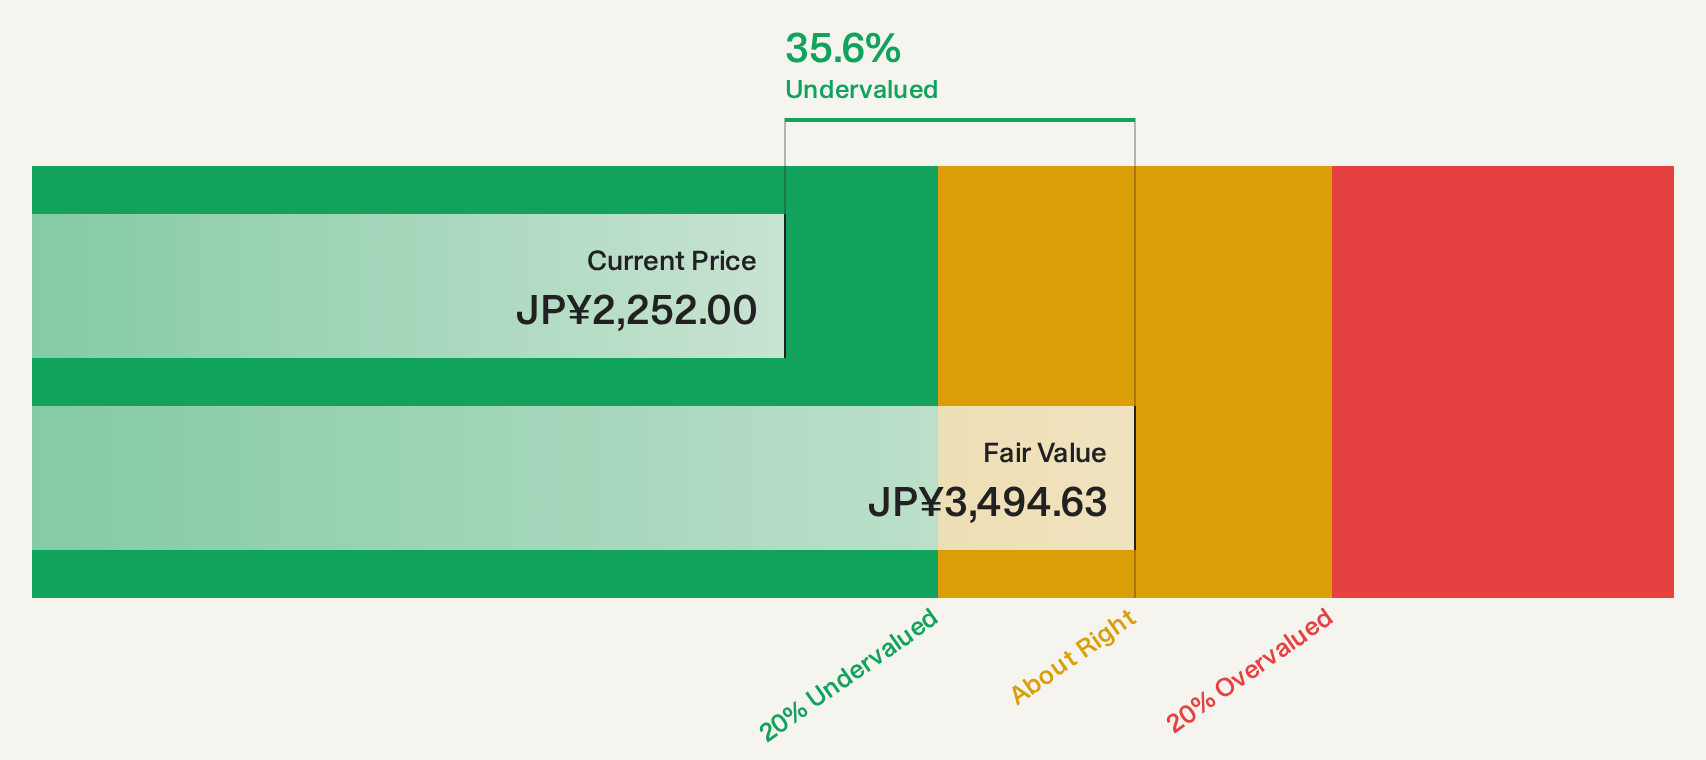
Estimated Discount To Fair Value: 35.7%
Toenec is trading at ¥2,247, significantly below its estimated future cash flow value of ¥3,492.95. Recent earnings show strong performance with net income rising to ¥4.39 billion from ¥2.06 billion year-on-year, despite slower forecasted revenue growth of 3.4% per year compared to the Japanese market average of 6.3%. While its dividend track record is unstable, it offers good relative value within its industry and peers.
- The growth report we've compiled suggests that Toenec's future prospects could be on the up.
- Take a closer look at Toenec's balance sheet health here in our report.
Niterra (TSE:5334)
Overview: Niterra Co., Ltd. manufactures and sells spark plugs, related products for internal-combustion engines, and technical ceramics both in Japan and internationally, with a market cap of ¥1.40 trillion.
Operations: The company's revenue is primarily derived from its Automotive Components segment, which accounts for ¥611.64 billion, followed by Component Solutions at ¥138.95 billion.
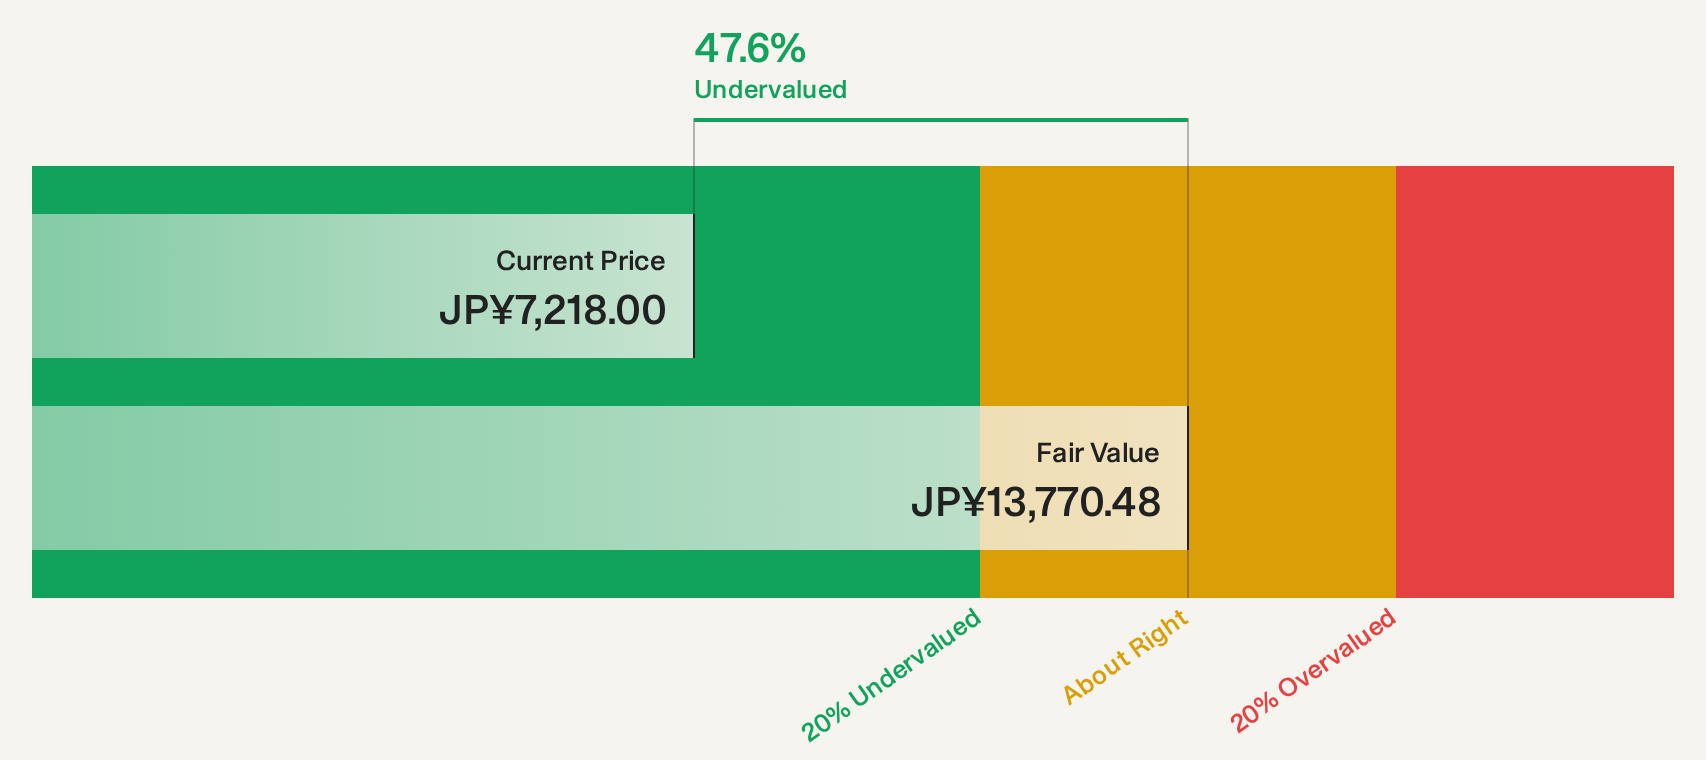
Estimated Discount To Fair Value: 47.4%
Niterra is trading at ¥7,236, significantly below its estimated future cash flow value of ¥13,768.84. Despite a recent 109.6% earnings increase, forecasts indicate a 9% annual earnings decline over the next three years. Revenue is expected to grow at 6.71% annually, slightly above the market average of 6.3%. The company completed substantial buybacks totaling ¥29.99 billion but faces an unstable dividend track record following recent adjustments due to a stock split.
- Our earnings growth report unveils the potential for significant increases in Niterra's future results.
- Unlock comprehensive insights into our analysis of Niterra stock in this financial health report.
Turning Ideas Into Actions
- Take a closer look at our Undervalued Global Stocks Based On Cash Flows list of 109 companies by clicking here.
- Are any of these part of your asset mix? Tap into the analytical power of Simply Wall St's portfolio to get a 360-degree view on how they're shaping up.
- Unlock the power of informed investing with Simply Wall St, your free guide to navigating stock markets worldwide.
Ready To Venture Into Other Investment Styles?
- Explore high-performing small cap companies that haven't yet garnered significant analyst attention.
- Diversify your portfolio with solid dividend payers offering reliable income streams to weather potential market turbulence.
- Fuel your portfolio with companies showing strong growth potential, backed by optimistic outlooks both from analysts and management.
This article by Simply Wall St is general in nature. We provide commentary based on historical data and analyst forecasts only using an unbiased methodology and our articles are not intended to be financial advice. It does not constitute a recommendation to buy or sell any stock, and does not take account of your objectives, or your financial situation. We aim to bring you long-term focused analysis driven by fundamental data. Note that our analysis may not factor in the latest price-sensitive company announcements or qualitative material. Simply Wall St has no position in any stocks mentioned.
Have feedback on this article? Concerned about the content? Get in touch with us directly. Alternatively, email editorial-team@simplywallst.com