
- PRICING
- LIVE QUOTES
- LEARN
- HELP


EN
W. R. Berkley (WRB) Could Be 18% Below Fair Value Following Dividend News
W. R. Berkley (WRB) highlighted income for shareholders after its Board of Directors affirmed a regular quarterly cash dividend of $0.10 per share, payable on September 30, 2026, to stockholders of record on September 21.
At a share price of US$70.10, W. R. Berkley has seen modest short term moves, with the 90 day share price return of 4.35% sitting against a 1 year total shareholder return that declined 1.45%, yet a 5 year total shareholder return of 143.33% signals momentum built over the longer horizon.
Compare how W. R. Berkley stacks up against other insurers that offer stable income potential by reviewing a curated set of 6 dividend fortresses.
Shareholders have seen modest gains over the past quarter while the 1-year return moved slightly backward. This raises the question of whether most of the easy upside in W. R. Berkley is already gone or whether valuation still points to more room ahead.
Most Popular Narrative: 16% Undervalued
Against the last close at $70.10, the most followed narrative pegs W. R. Berkley’s fair value at $83.00. This frames today’s share price as materially below that estimate and hinges on how underwriting and investment income evolve from here.
The bullish analysts expect earnings to reach $2.1 billion (and earnings per share of $5.64) by about July 2029, up from $1.9 billion today. The analysts are largely in agreement about this estimate.
See why 0 investors see W. R. Berkley as 16% undervalued.
Result: Fair Value of $83 (UNDERVALUED)
Still, the bullish W. R. Berkley narrative leans on assumptions that could crack if catastrophe losses climb faster than pricing or if competition forces weaker underwriting terms.
Find out about the key risks to this W. R. Berkley narrative.
Another View: What Multiples Say About W. R. Berkley
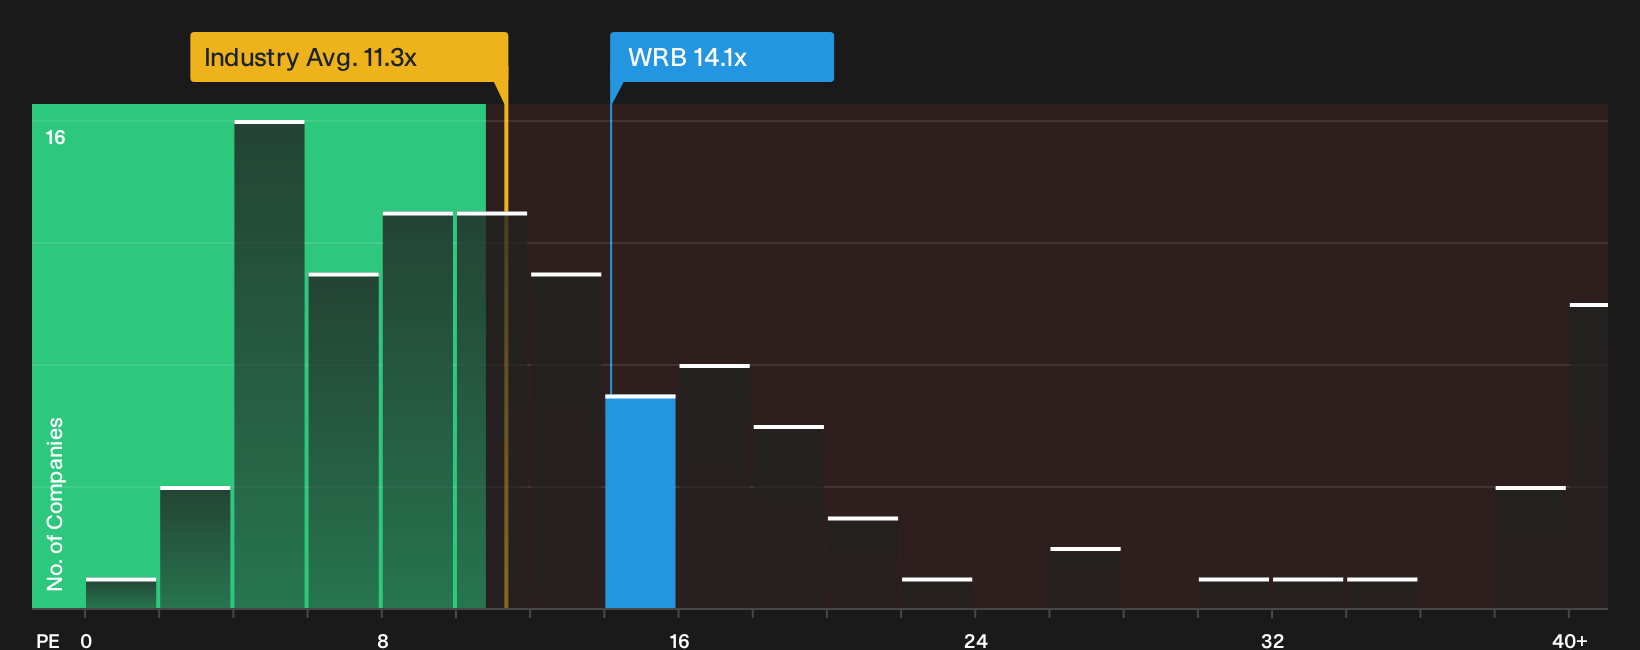
While the bullish W. R. Berkley narrative leans on a fair value of $83, the current P/E of 14.1x paints a different picture. It sits above the US Insurance industry at 11.3x, the peer average at 9.2x, and even a fair ratio of 11x, which points to richer pricing. That gap raises a simple question: Is this a margin of safety or a margin of risk?
For a closer look at how this pricing compares with earnings power, valuation risk and the fair ratio, See what the numbers say about this price — find out in our valuation breakdown.
Next Steps
Conflicted by the mix of risk flags and upside signals around W. R. Berkley. Move quickly, review the underlying data, and test the balance of 2 key rewards and 2 important warning signs.
Looking for more W. R. Berkley sized opportunities?
If W. R. Berkley has you thinking harder about risk, reward, and pricing, do not stop with a single ticker. Use the Simply Wall St screener to line up fresh ideas before the next move leaves you reacting instead of prepared.
- Target potential bargains where quality and pricing meet by scanning a curated pool of 29 high quality undervalued stocks.
- Prioritize resilience first and hunt for companies that score well on financial strength using the list of solid balance sheet and fundamentals (23 results).
- Hunt for tomorrow's quiet outperformers by reviewing a focused set of 16 high quality undiscovered gems.
This article by Simply Wall St is general in nature. We provide commentary based on historical data and analyst forecasts only using an unbiased methodology and our articles are not intended to be financial advice. It does not constitute a recommendation to buy or sell any stock, and does not take account of your objectives, or your financial situation. We aim to bring you long-term focused analysis driven by fundamental data. Note that our analysis may not factor in the latest price-sensitive company announcements or qualitative material. Simply Wall St has no position in any stocks mentioned.
Have feedback on this article? Concerned about the content? Get in touch with us directly. Alternatively, email editorial-team@simplywallst.com