
- PRICING
- LIVE QUOTES
- LEARN
- HELP


EN
CTP (ENXTAM:CTPNV) Lands New Poland Leases, Does It Look Fully Valued?
CTP (ENXTAM:CTPNV) just locked in more than 104,000 sqm of new leases at its CTPark Ilowa site in western Poland, tied to Asian e-commerce and third-party logistics tenants.
CTP’s recent leasing wins arrive after a mixed run for the stock, with the share price at €13.48 and a year-to-date share price return down 23.58%, while the 3-year total shareholder return of 15.33% still points to longer-term gains despite short-term pressure on sentiment.
Scan the logistics real estate space for other potential beneficiaries of e-commerce supply chains by checking our curated list of list of solid balance sheet and fundamentals (194 results).
CTP trades about 4% below one intrinsic value estimate and roughly 49% below the average analyst target after a sharp slide this year. Is that a genuine margin of safety, or a warning that the market is pricing risk correctly?
Preferred P/E of 11.9: Is it justified for CTP?
CTP screens as cheaper than one intrinsic value estimate at €14.07 and below the average analyst target of €20.09, yet its current P/E of 11.9 suggests the market is not treating it as a bargain relative to peers.
The P/E ratio compares the current share price with earnings and, for a real estate operator like CTP, it effectively reflects what investors are willing to pay today for each euro of profit from its logistics and industrial portfolio.
CTP is described as trading at 4.2% below one fair value estimate based on the SWS DCF model. Analysts also cluster around a target that is roughly 49% above the last close. However, the stock is labelled expensive against both the peer average P/E of 9x and the broader European real estate P/E of 11.8x.
This means the market is assigning a higher earnings multiple than comparables even though CTP carries flags such as weaker interest cover, a dividend that is not well backed by free cash flow, and earnings distorted by large one off items in the last twelve months.
On the other hand, the same data points to 22.1% expected annual earnings growth against 17.3% for the Dutch market, experienced leadership, and a board with a majority of independent directors. These factors could help explain why investors are prepared to pay slightly more than the sector average P/E despite a tougher recent share price record.
Result: Price-to-earnings of 11.9x (OVERVALUED).
See what the numbers say about this price — find out in our valuation breakdown.
Still, CTP’s weaker interest cover and dividend, which is not well supported by free cash flow, could quickly challenge any argument that the current discount looks comfortable.
Find out about the key risks to this CTP narrative.
Another view on CTP’s value
The SWS DCF model points in a different direction than the 11.9x P/E label. On that framework, CTP at €13.48 sits about 4.2% below an estimated cash flow value of €14.07, which suggests a modest cushion rather than a clear premium. Is the gap big enough to matter for you as an investor?
Look into how the SWS DCF model arrives at its fair value.
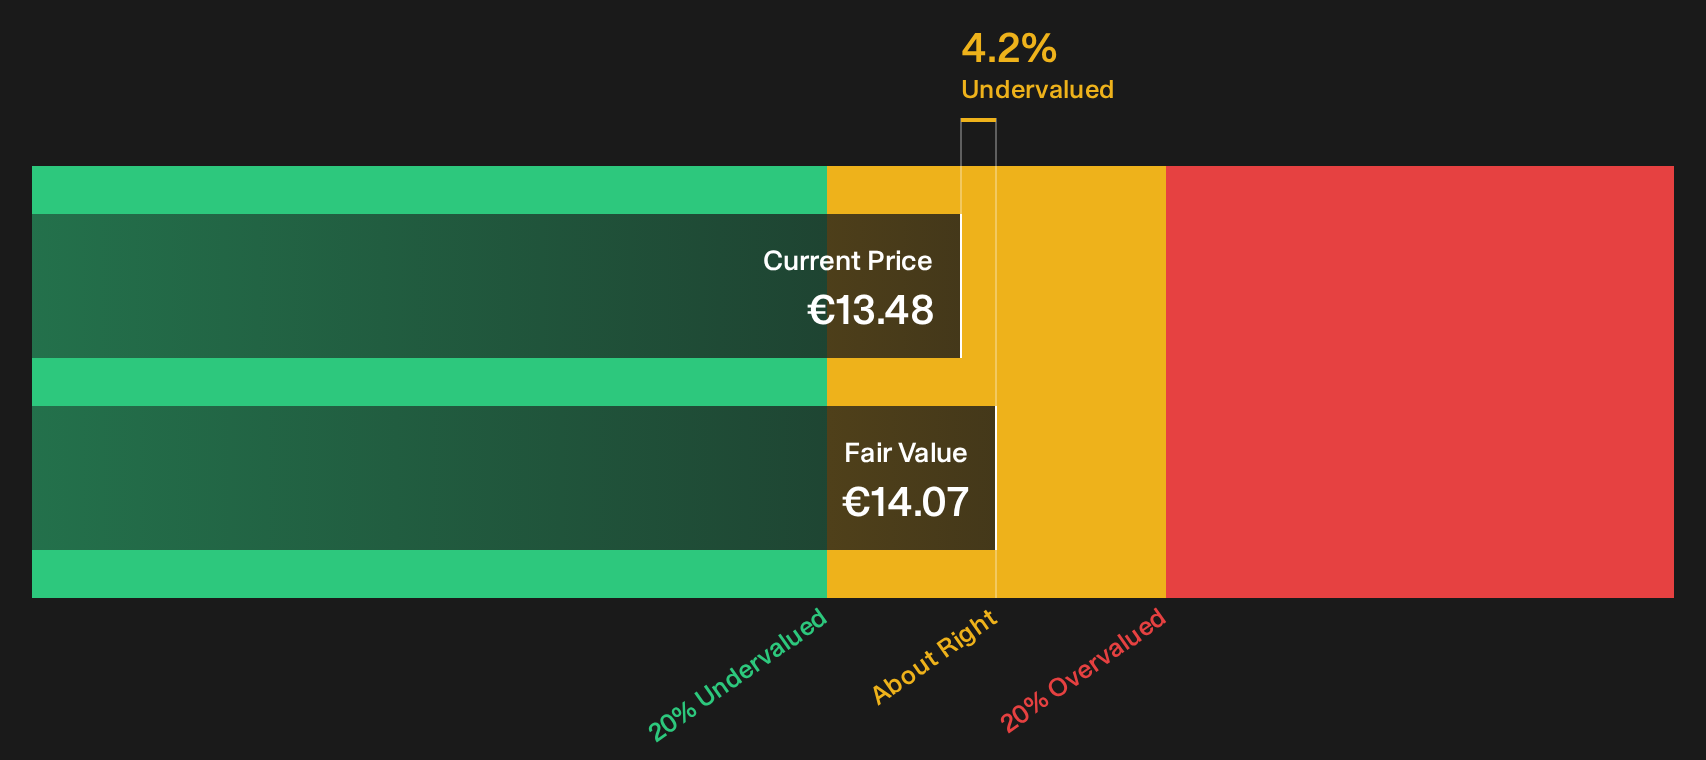
Simply Wall St performs a discounted cash flow (DCF) on every stock in the world every day (check out CTP for example). We show the entire calculation in full. You can track the result in your watchlist or portfolio and be alerted when this changes, or use our stock screener to discover 177 high quality undervalued stocks. If you save a screener we even alert you when new companies match - so you never miss a potential opportunity.
Next Steps
Conflicted about what CTP’s mix of pressure points and potential upsides really adds up to right now? Review the underlying numbers yourself, move quickly before the story shifts again, and weigh both sides of the argument with the help of our breakdown of 3 key rewards and 4 important warning signs
Looking for more CTP investment ideas?
If CTP has sharpened your focus on quality and price, do not stop here. Broaden your list now so you are not reacting after the next move.
- Target potential mispricings by scanning our curated pool of 177 high quality undervalued stocks that combine solid fundamentals with room for the market to catch up.
- Strengthen your income stream by reviewing a focused set of 160 dividend fortresses built around higher yields and balance sheets that aim to support regular payouts.
- Sleep easier at night by filtering for 104 resilient stocks with low risk scores where lower risk scores and steadier financial profiles take priority over headline excitement.
This article by Simply Wall St is general in nature. We provide commentary based on historical data and analyst forecasts only using an unbiased methodology and our articles are not intended to be financial advice. It does not constitute a recommendation to buy or sell any stock, and does not take account of your objectives, or your financial situation. We aim to bring you long-term focused analysis driven by fundamental data. Note that our analysis may not factor in the latest price-sensitive company announcements or qualitative material. Simply Wall St has no position in any stocks mentioned.
Have feedback on this article? Concerned about the content? Get in touch with us directly. Alternatively, email editorial-team@simplywallst.com