
- PRICING
- LIVE QUOTES
- LEARN
- HELP


EN
Is Banc of California (BANC) Undervalued After Its Recent Pullback?
Banc of California (BANC) has drawn investor attention after its latest share price of $18.28 left the stock down over the past month and past 3 months. That reset invites a closer look.
Over the past few months, Banc of California has seen its share price slip, with a 30 day share price return down 7.16% and a 90 day share price return down 9.01%. At the same time, the 1 year total shareholder return is up 13.98% and the 3 year total shareholder return is up 63.96%. This points to fading short term momentum alongside a still positive multi year record shaped by earlier gains and dividends.
Scan how Banc of California stacks up against other banks resetting after a pullback by reviewing the hand picked 11 resilient stocks with low risk scores in the sector.
Banc of California has pulled back in the short term while still carrying a stronger multi year record. At today’s price, does that reset still leave the risk reward tilted toward new buyers or favor patience instead?
Most Popular Narrative: 24% Undervalued
At a last close of $18.28, the most followed narrative on Banc of California pegs fair value at $24.00. This implies a sizeable valuation gap that rests on a rebuild of earnings power after recent losses.
Ongoing remix of the balance sheet toward higher yielding C&I, warehouse, lender finance and venture loans, combined with roughly $4 billion of lower coupon loans repricing by 2025, is described as structurally lifting net interest margin and supporting double digit earnings growth.
See why 0 investors see Banc of California as 24% undervalued.
Result: Fair Value of $24.00 (UNDERVALUED)
Still, the bullish Banc of California story runs into real friction if credit losses stay elevated or deposit costs do not ease as analysts assume.
Find out about the key risks to this Banc of California narrative.
Another View On Banc of California’s Valuation
The bullish fair value narrative presents Banc of California as undervalued at $18.28 versus a $24.00 target. A different lens tells a cooler story. The SWS DCF model values projected cash flows at $16.64, which frames the current quote as slightly expensive rather than cheap.
The gap between a cash flow based estimate and a more optimistic narrative raises a practical question for you: Which set of assumptions feels closer to how Banc of California can realistically perform over the next several years?
Look into how the SWS DCF model arrives at its fair value.
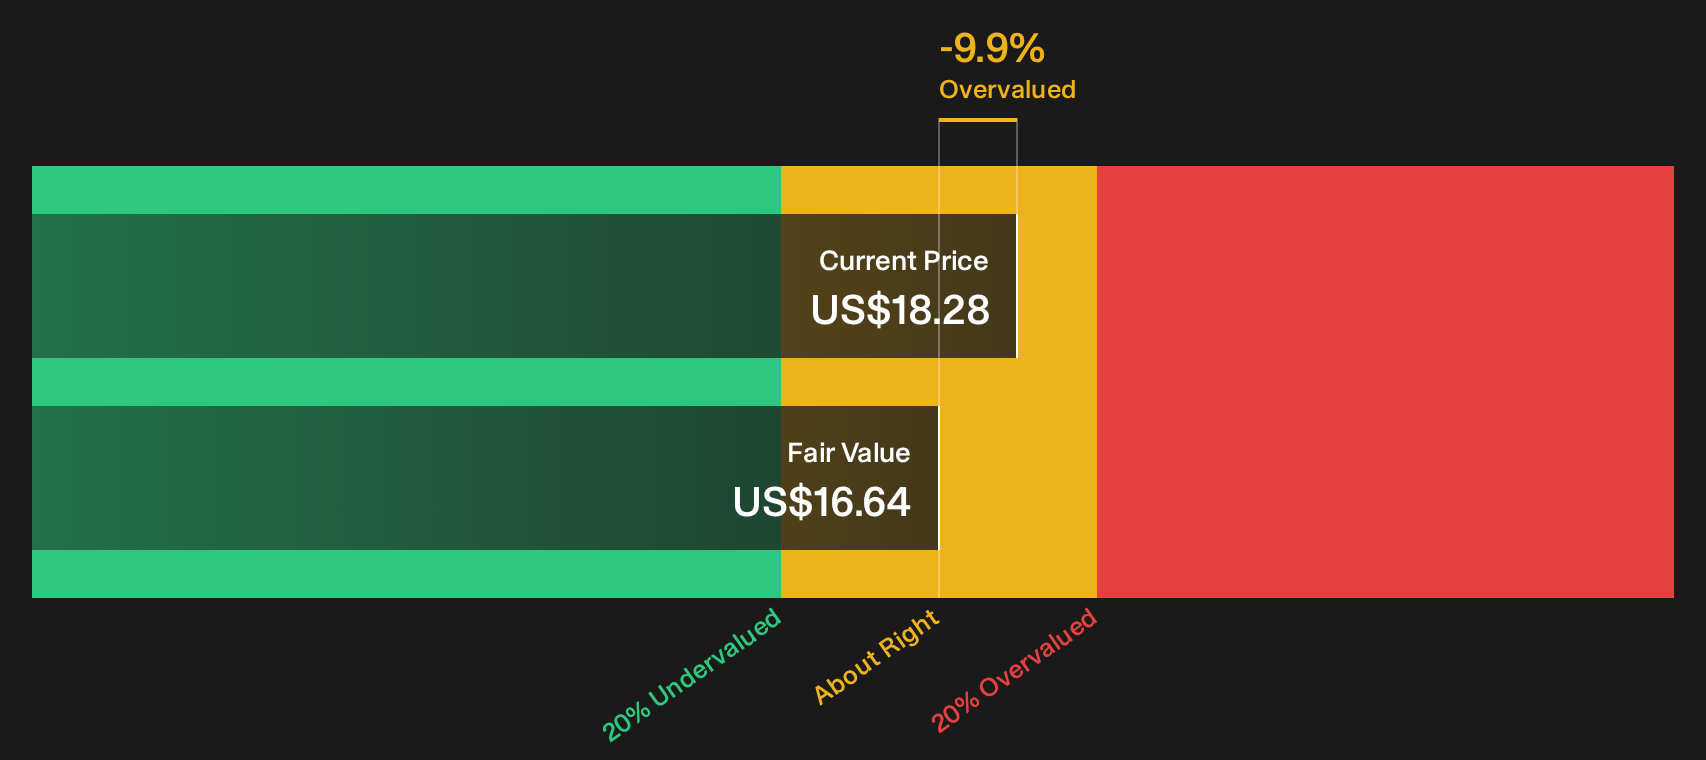
Simply Wall St performs a discounted cash flow (DCF) on every stock in the world every day (check out Banc of California for example). We show the entire calculation in full. You can track the result in your watchlist or portfolio and be alerted when this changes, or use our stock screener to discover 33 high quality undervalued stocks. If you save a screener we even alert you when new companies match - so you never miss a potential opportunity.
Next Steps
Sentiment across Banc of California is mixed, with both clear concerns and genuine bright spots in the data. Consider those trade offs for yourself, and then check the full breakdown of 2 key rewards and 2 important warning signs
Looking for more Banc of California style investment ideas?
Do not stop with Banc of California. Use the Simply Wall St screener to quickly surface fresh opportunities that match the kind of edge you are hunting for.
- Target potential bargains by lining up quality fundamentals with attractive pricing using the 33 high quality undervalued stocks.
- Strengthen portfolio resilience by focusing on companies that carry robust finances through the list of solid balance sheet and fundamentals (22 results).
- Spot lesser known opportunities with strong underlying metrics before they become crowded through the 16 high quality undiscovered gems.
This article by Simply Wall St is general in nature. We provide commentary based on historical data and analyst forecasts only using an unbiased methodology and our articles are not intended to be financial advice. It does not constitute a recommendation to buy or sell any stock, and does not take account of your objectives, or your financial situation. We aim to bring you long-term focused analysis driven by fundamental data. Note that our analysis may not factor in the latest price-sensitive company announcements or qualitative material. Simply Wall St has no position in any stocks mentioned.
Have feedback on this article? Concerned about the content? Get in touch with us directly. Alternatively, email editorial-team@simplywallst.com