
- PRICING
- LIVE QUOTES
- LEARN
- HELP


EN
Did Retirement Platform Deal Just Shift Principal's (PFG) Investment Narrative?
- Principal Financial Group announced a new engagement with SS&C Retirement Solutions, using its RICC platform to handle connectivity and administration for an expanded retirement income product suite, including both proprietary and third party offerings.
- The decision ties Principal Financial Group’s retirement income focus directly to external infrastructure. This can influence product rollout speed, servicing quality and long term cost efficiency in its retirement ecosystem.
- We will look at how Principal Financial Group’s investment narrative is affected by deeper SS&C integration across its retirement income platform.
Principal Financial Group Investment Narrative Recap
To own Principal Financial Group, you need to believe its mix of retirement, asset management and benefits can keep attracting sticky assets even when markets turn choppy. The closer integration with SS&C on retirement income and the refreshed credit facility both lean into that retirement ecosystem focus, but do not radically change the near term picture.
The key near term swing factor remains flows, especially whether higher fee and retirement oriented mandates offset institutional fixed income withdrawals. The main risk still sits with market driven fee pressure and client risk off behavior in asset management, plus any earnings variability from claims and competitive pricing in benefits.
The amended and restated five year US$900m unsecured credit facility, with the option to lift total commitments to US$1.3b, is the most relevant recent move. It refreshes Principal Financial Group’s liquidity support for general corporate uses without tying it to a specific product or deal, which matters when retirement income and asset management both rely on balance sheet flexibility.
For you as a shareholder, this sits in the catalyst stack as an enabler rather than a driver. It can support continued cost discipline, product investment and potential responses to market volatility, while covenants on statutory surplus and total debt to capital help frame downside risk if earnings pressure from fees, flows or claims were to build.
Principal Financial Group Earnings and Valuation Set Up
Principal Financial Group's current analyst storyline is built around a steady earnings climb rather than a step change. Forecasts point to revenue growing at 7.9% per year over the next few years, with profit margins moving from 9.9% today to 12.5% by around 2029. On that path, earnings are expected to reach US$2.5b by 2029, compared with US$1.6b today, while the share count is projected to shrink by 2.54% annually as buybacks chip away at outstanding stock.
That earnings bridge matters for how you think about the multiple. Analysts are effectively underwriting a move from a P/E of 15.5x today to 10.9x on those 2029 earnings. This is slightly below the 11.3x level cited for the wider US insurance peer group. In simple terms, the story is that profit grows, the valuation multiple compresses, and the two effects balance out to support a fairly full price, rather than a deep value setup or an obvious bargain.
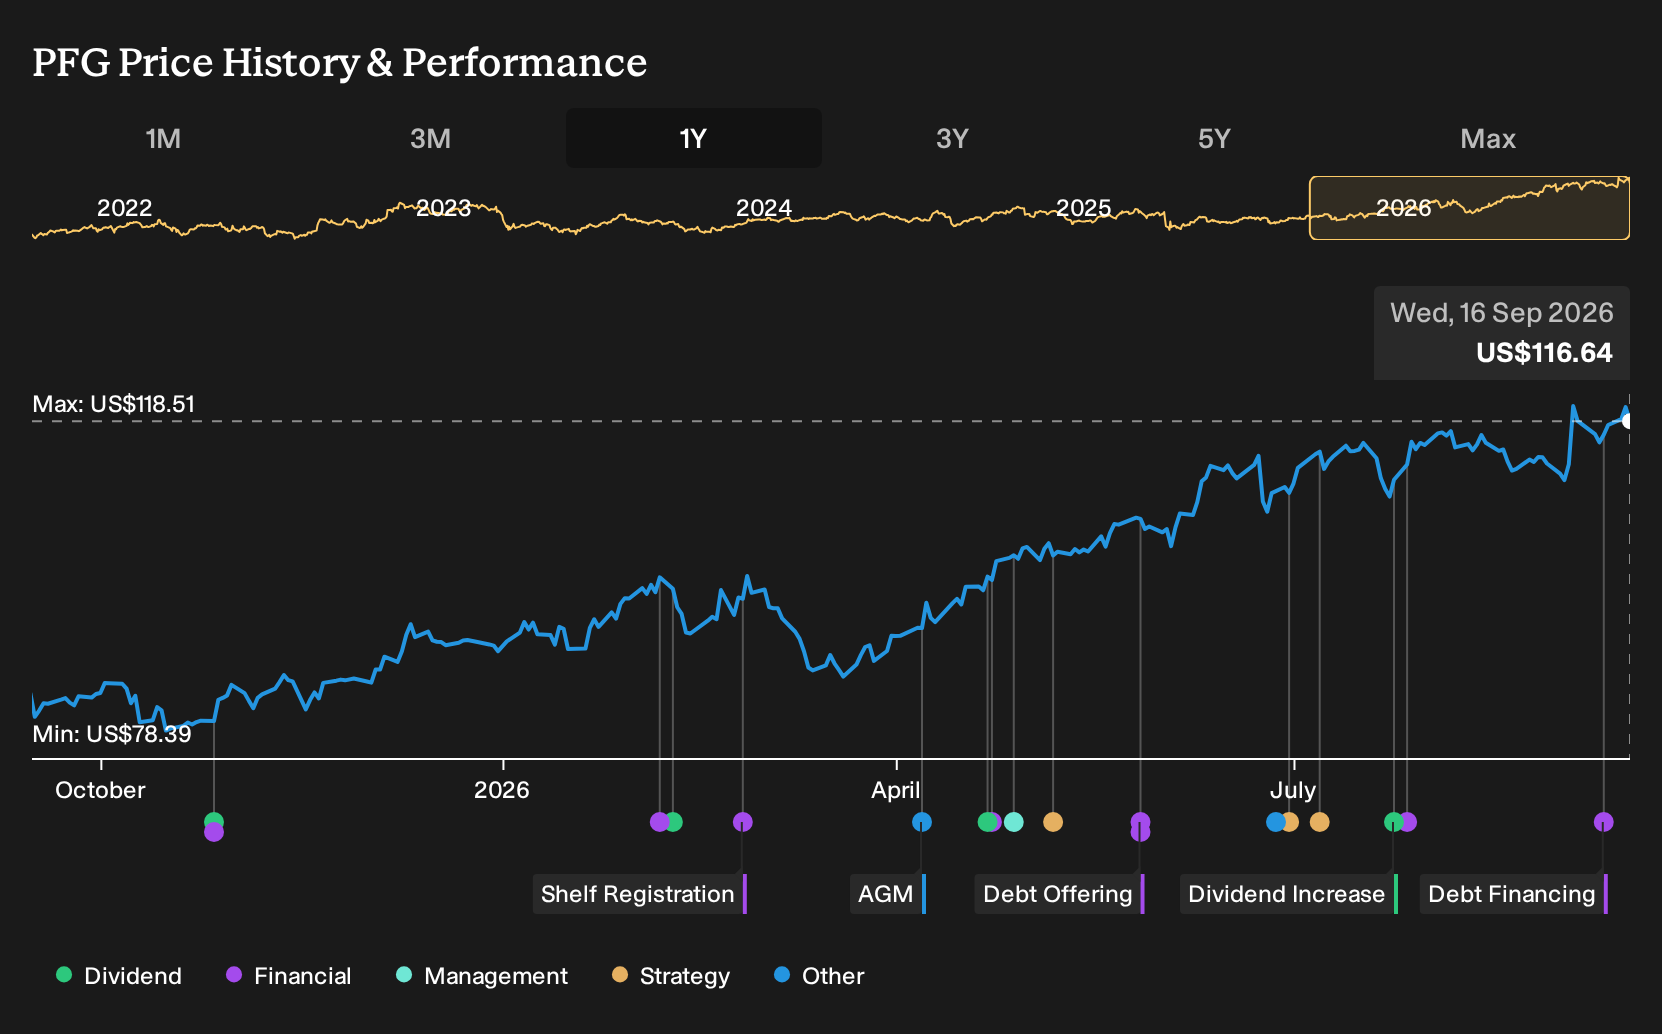
On the revenue side, the consensus pins 2029 turnover at US$19.7b with the same US$2.5b earnings figure, using a discount rate of roughly 7.2% to translate that future profile into today's value. Against a current share price of US$113.14, the average analyst target of US$109.58 sits about 3.2% lower. This points to a view that Principal Financial Group already reflects much of this retirement income and asset management thesis in its quote. The spread between the most bullish target of US$125.00 and the most cautious at US$92.00 shows how much your own conviction on fee resilience, flows and benefits pricing will drive whether you see upside or just fully priced execution risk.
Principal Financial Group's narrative projects US$19.7b revenue and US$2.5b earnings by 2029. This assumes 7.9% yearly revenue growth and an earnings increase of about US$0.9b from US$1.6b today.
Uncover why Principal Financial Group's fair value indicates a 6% potential downside to its current price, which leaves little room for error.
Exploring Other Perspectives
You get a very different angle if you focus on digital execution risk. The most bullish analysts who target US$125.00 already modeled about US$19.6b of 2029 revenue and US$2.5b of earnings before this new SS&C and credit facility news. If you think Principal Financial Group can use this extra flexibility to accelerate digital progress, their optimism may look more reasonable. If you worry digital efforts still lag, the more cautious US$92.00 view might feel closer to home. Either way, treat these pre news forecasts as a starting point and explore which version of the story you find more convincing.
Explore 2 other Principal Financial Group fair value estimates, including one that suggests as much as 87071758395% upside from the current price!
Form Your Own Verdict
Don't just follow the ticker. Dig into the data and build a conviction that's truly your own.
- A great starting point for your Principal Financial Group research is our analysis highlighting 4 key rewards that could impact your investment decision.
- See our latest analysis for Principal Financial Group. The report includes a comprehensive fundamental analysis summarized in a single visual, the Snowflake, making it easy to evaluate Principal Financial Group's overall financial health at a glance.
Looking for more investment ideas beyond Principal Financial Group?
If the Principal Financial Group story has you thinking about portfolio balance and risk, it can help to scan a wider field of opportunities using the Simply Wall St Screener. You can filter by quality, income, or balance sheet strength so you are not just reacting to one stock but weighing it against a broader watchlist.
- If you want income that can potentially complement Principal Financial Group, start with companies offering robust yields and payout histories using the 6 dividend fortresses.
- For investors focused on value and quality together, track financially strong businesses trading below their estimated worth through the 33 high quality undervalued stocks.
- If capital preservation sits high on your priority list, concentrate on financially resilient firms with strong fundamentals by running a list of solid balance sheet and fundamentals (22 results).
This article by Simply Wall St is general in nature. We provide commentary based on historical data and analyst forecasts only using an unbiased methodology and our articles are not intended to be financial advice. It does not constitute a recommendation to buy or sell any stock, and does not take account of your objectives, or your financial situation. We aim to bring you long-term focused analysis driven by fundamental data. Note that our analysis may not factor in the latest price-sensitive company announcements or qualitative material. Simply Wall St has no position in any stocks mentioned.
Have feedback on this article? Concerned about the content? Get in touch with us directly. Alternatively, email editorial-team@simplywallst.com